
Introduction
Rheumatoid arthritis (RA) is a systemic autoimmune disease characterized by synovitis and joint erosion in addition to extra-articular manifestations including pulmonary, and vascular disease has appeared. It affects ~0.5–1% of the population [1]. In a female/male ratio ranging from 2 : 1 to 4 : 1, RA is an insidious disease, typically having an onset of symmetric joint swelling and reaching a peak incidence in the fourth and fifth decades [2].
The etiology of RA remains uncertain but some studies attribute the cause of disease to environmental and genetic factors [3]. Rheumatoid arthritis is a long term autoimmune disease manifesting with signs of inflammation, swollen and warm painful joints, in addition to stiffness, particularly early in the morning on waking or following prolonged inactivity [4]. Rheumatoid arthritis represents the most common form of autoimmune diseases and immune cell infiltrates are observed in synovial tissues of RA patients [5]. The production of certain inflammatory markers by different cells such as monocytes/macrophages, fibroblast-like synoviocytes, and dendritic cells plays a central role in promoting and maintaining joint inflammation [6].
There is a continuous need for some better diagnostic biomarkers for early identification of RA. Studies were focused on some trace elements [7] and various proteins [8].
Chemerin is one of the possible future biomarkers of an inflammatory response [9]. It is a 16 kDa protein purified from ascetic fluids of ovarian cancer patients and synovial exudates of RA patients. Chemerin revealed anti-inflammatory and pro-inflammatory effects by binding with the CMKLR1 receptor [9]. Chemerin is also involved in innate and adaptive immunity as a chemoattractant for natural killer cells, macrophages, and certain dendritic cell subsets [10], in addition to being an adipokine [11].
The term adipokine was applied to all the substances that have biological activity synthesized by white adi- pose tissue (WAT) which function as a regulator of energy homeostasis and metabolism; the same mediators were also involved in chronic inflammation and metabolic dysfunctions [12]. White adipose tissue is known as a pleiotropic organ specialized in endocrine functions being able to create several hormones and other proteins involved in both physiological and pathological processes, as well as immunity and inflammation [13]. Obesity is a risk factor for autoimmune diseases such as RA [7] since adipose tissue releases adipokines able to create a low-grade inflammatory environment [14]. Recently, chemerin has emerged as a key adipokine involved in the immune response. Overweight and obese healthy subjects show higher chemerin values than normal weight, whose plasma values decrease after diet [15].
Another pro-inflammatory adipokine that potentially plays a role in the diagnosis of RA is visfatin: a pre-B cell colony-enhancing factor involved in early β-cell development and acts as a nicotinamide phosphoribosyltransferase secreted mainly by visceral fat [16]. It is also seen in the liver, skeletal muscles, and bone marrow and produced by visceral WAT, which mimics the effects of insulin [17]. The pro-inflammatory action of visfatin was described to be mediated by the insulin signaling pathway and showed an increase of serum visfatin levels in patients with RA [18]. The potential role of adipocytokines such as chemerin and visfatin in mediating joint damage needs more investigation.
The goal of the present study is to measure the level of serum chemerin and visfatin, in addition to their relationship in RA patients and calculate their ability to be a future diagnostic tool for RA. The factors that may affect their levels (lipid profile, uric acid [UA], body mass index [BMI], and C-reactive protein [CRP]) were also studied by using correlation studies and multivariate general linear model (GLM) analysis.
Material and methods
This case-control study was conducted in Al-Sader Teaching Hospital in Al-Najaf province, Iraq, during the period from January 2019 to March 2019. The present study included 60 RA patients and 30 healthy controls. The age and gender of RA patients and the control groups were matched. Rheumatoid arthritis patients were diagnosed according to the criteria established in 2010 by the American College of Rheumatology and the European League Against Rheumatism [19].
Approval for the study was obtained from the ethics committee (IRB) of the University of Kufa, Iraq (111/2018), which complies with the International Guideline for Human Research protection as required by the Declaration of Helsinki.
All patients have achieved a total score more than 6 from the 4 domains: the number and site of involved joints, serologic abnormalities (presence of rheumatoid factor – RF) or high anti-citrullinated protein antibodies (ACPA), elevations of inflammatory markers (erythrocyte sedimentation rate – ESR) and/or CRP, and the duration of symptoms. Socio-demographic, family history information and the clinical characteristics of the RA disease were collected. Disease Activity Score using 28 joints (DAS28) and ESR were calculated by input the information into an online calculator available at https://www.mdcalc.com/disease-activity-score-28-rheumatoid-arthritis-esr-das28-esrat which a DAS28 value more than 5.1 indicated active disease.
The RA disease activity of all patients was moderate to high according to the Clinical Disease Activity Index (CDAI), which was more than 10. Body mass index (BMI) was measured by dividing weight in kilograms by height of subjects in square meters.
Patients and controls were evaluated by full medical history to exclude any existing systemic disease that may affect the parameters to be diagnosed, particularly diabetes, cardiovascular disease, hypertension, liver disease, and renal disease; otherwise, the patient was excluded from the study. Also, the current study excluded patients in the remission phase of disease or the inactive form of the disease. We also excluded smoking subjects.
Measurements
Seven milliliters of fasting venous blood samples were collected from patients and the control group after overnight fasting and allowed to clot at 37°C then centrifuged at 3000 rpm for 15 minutes. Sera were separated and frozen at –20°C until analysis. ACPA tests were carried out by using a semi-quantitative test kit supplied by Hotgen Biotech Co., Ltd. China. Serum chemerin and visfatin were determined by ELISA assay supplied by Elabscience, USA.
The principle of the measurements was based on the sandwich ELISA method. Serum TC, TG, and UA were measured spectrophotometrically by enzymatic reactions using ready-for-use kits supplied by Spinreact, Spain. CRP and RF semiquantitative kits supplied from the same company. Serum HDLc was determined after the precipitation of other lipoproteins by the reagent containing sodium phosphotungstate along with MgCl2, and the cholesterol contents in the supernatant were measured using the cholesterol kit. VLDLc was calculated using the formula TG/2.19, and LDLc was computed from Friedewald’s formula: LDLc = TC −HDLc−VLDLc.
Statistical analysis
The distribution of the results was examined using the Kolmogorov-Smirnov test and found as a normal statistical distribution for all the measured parameters. All results were expressed as mean ±standard deviation. The pooled t-test was used for the comparison between the patients and control groups and among subdivided groups in the measured parameters. Pearson’s correlation coefficients (r) were calculated to estimate the correlation between parameters. General linear model (GLM) analysis was used to assess the effects of diagnosis while controlling for confounding variables including BMI and age. Receiver operating curve (ROC) analysis was used to study the opportunity of using chemerin, visfatin, and their ratio as a diagnostic tool for RA. The difference between groups is considered statistically different when p < 0.05.
All statistical analysis was performed using SPSS Statistics Version 25 (2017) by IBM, USA.
Results
Socio-demographic, clinical and blood parameter characteristics
The socio-demographic and clinical data of the RA patient and healthy control groups are presented in Table I. The results show no significant difference in age or BMI in the RA group in comparison with the control group. CRP and UA were also increased in patients, indicating the involvement of inflammation and high uric acid in the inflammatory response of the patients.
Table I.
Socio-demographic, clinical and biomarker data in rheumatoid arthritis patients as compared with healthy controls
[i] ACPA – anti-citrullinated peptide/protein antibodies, BMI – body mass index, CDAI – Clinical Disease Activity Index, CRP – C-reactive protein, DAS28 – Disease Activity Score using 28 joints, ESR – erythrocyte sedimentation rate, HDLc – high-density lipoprotein cholesterol, LDLc – low-density lipoprotein cholesterol, RF – rheumatoid factor, TC – total cholesterol, TG – triglyceride, VLDLc – very-low-density lipoprotein cholesterol.
Visfatin, chemerin and their ratios also increased in patients as compared with controls. There is a significant increase in all lipid profile components except HDLc, which decreased in patients as compared with controls. Atherogenic indices (TC/HDLc, TG/HDLc, and LDLc/HDLc) increased, which revealed a susceptibility to atherosclerosis and heart diseases.
Multivariate general linear model analysis with blood parameters
The results of multivariate GLM analysis with the biomarkers as dependent variables and diagnosis as an explanatory variable are presented in Table II. The analysis showed a strong effect of being RA patients on all measured parameters i.e., 70.7% of the change in the level of measured parameters can be explained by the presence of RA disease (partial η2 = 0.707, p< 0.001). Age and BMI have a small and statistically insignificant effect on the measure parameters (partial η2 = 0.075, p = 0.071, and partial η2= 0.107, p = 0.054, respectively).
Table II.
Results of multivariate general linear model analysis with the biomarkers as dependent variables and diagnosis as an explanatory variable while adjusting for extraneous variables
To explore which parameters were affected by the diagnosis, we performed tests of the between-subjects effect in the second part of the table. The results showed that all biomarkers were affected significantly by the diagnosis and the larger effects were on CRP (partial η2= 0.480, p< 0.001), chemerin (partial η2= 0.295, p < 0.001), and UA (partial η2 = 0.252, p = 0.071), while visfatin showed partial η2= 0.079 only.
Correlation between parameters
The results in Table III indicate that visfatin was correlated positively with chemerin and negatively with chemerin/visfatin ratio. There is a positive correlation between chemerin and TC, HDLc, LDLc, LDLc/HDLc, CRP, UA, DAS28, and the duration of disease, while a significant negative correlation was observed between chemerin and HDLc. These results indicated a relationship between chemerin and lipid profile and inflammation status.
Table III.
Inter-correlation matrix of measured parameters in rheumatoid arthritis group
[i] BMI – body mass index, CDAI – Clinical Disease Activity Index, DAS28 – Disease Activity Scoreusing 28 joints, HDLc – high-densitylipoprotein cholesterol, LDLc – low-densitylipoprotein cholesterol, TC – total cholesterol, TG – triglyceride, VLDLc – very-low-densitylipoprotein cholesterol. * Correlationissignificantat the 0.05 level, ** correlationissignificantat the 0.01 level.
C-reactive protein shows a positive correlation with UA, BMI, chemerin/visfatin, TG, VLDLc, TC/HDLc, TG/HDLc, and LDLc/HDLc, while it was negatively correlated with HDLc. Uric acid has a positive correlation with TG/HDLc and a negative correlation with HDLc. Regarding age, the results indicate a negative correlation only with chemerin/visfatin.
Receiver operating curve as a diagnostic tool for rheumatoid arthritis
Results of the receiver operating curve(ROC) curve and AUC analysis for the visfatin and chemerin besides their ratio as possible diagnostic parameters for RA are presented in Figure 1 and Table IV. The results showed relatively good sensitivity and specificity of chemerin (sensitivity = 88.1%, specificity = 75.9%) at a concentration = 187.88 ng/ml in diagnosis of RA in comparison with visfatin (sensitivity = 64.4%, specificity = 58.6%) at a concentration = 39.02 ng/ml and the chemerin/visfatin ratio (sensitivity = 66.1%, specificity = 65.5%) at a cut-off value = 5.03.
Fig. 1
Receiver operating curve (ROC) of the chemerin (A), chemerin/visfatin (B), and visfatin (C) for the diagnosis of rheumatoid arthritis patients.
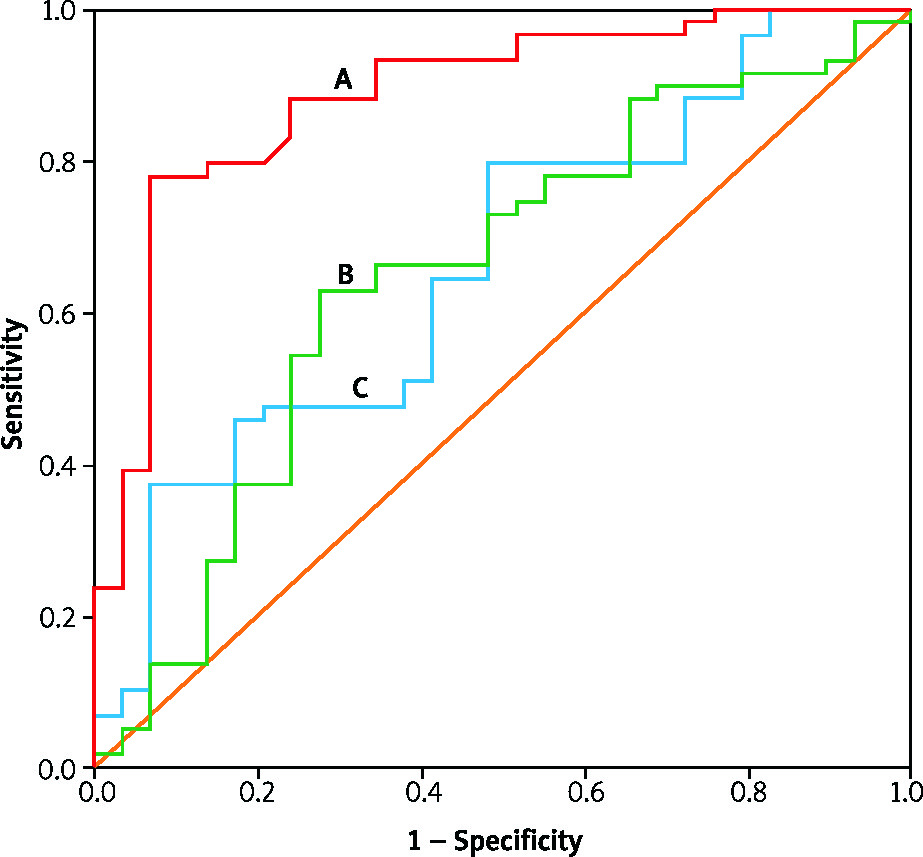
Table IV.
Data of ROC curve, AUC, sensitivity, and specificity of chemerin, visfatin, and their ratio in the diagnosis of rheumatoid arthritis
The p-values of the AUC are less than 0.05 and statistically significant. Youden’s J statistics of the parameters in Figure 1 confirm these results.
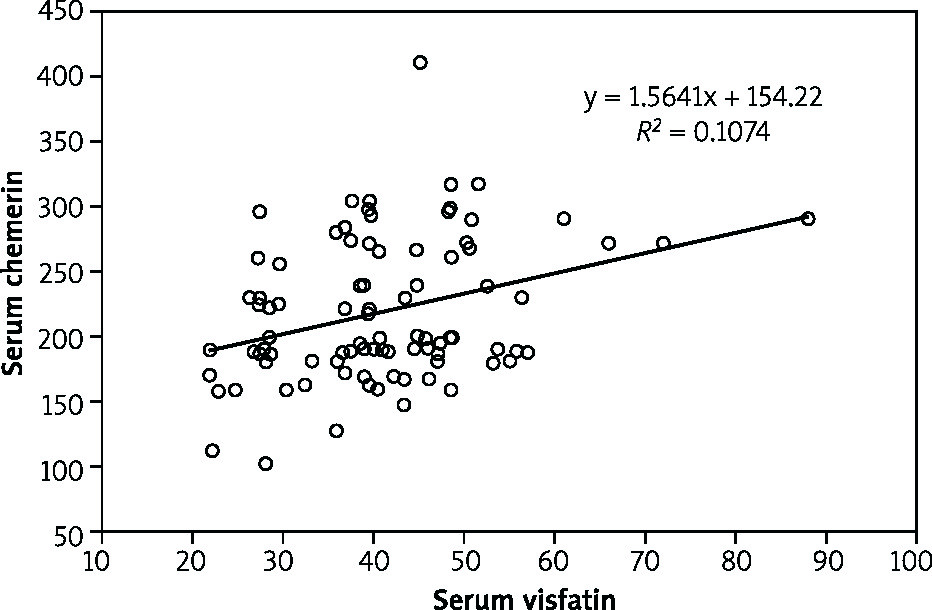
In Figure 2 also the correlation between chemerin and visfatin in rheumatoid arthritis patients is shown.
Effects of background variables
As described above, there were no significant effects of age and BMI on the biomarkers included. In patients with RA, we also examined the effects of drug administration on the total FF score and using univariate GLM analysis we found no significant effects of the use of methotrexate (F = 1.673, df = 1/59, p = 0.278), prednisolone (F = 0.020, df = 1/59, p = 0.745), sulfasalazine(F = 3.102, df = 1/59, p = 0.088), and tofacitinib (F = 0.467, df = 1/57, p = 0.524), or naproxen (F = 1.673, df = 1/55, p = 0.233), on the serum level of chemerin and visfatin FF score.
Discussion
The major finding in the present study is the significant increase in chemerin and visfatin levels in addition to a significant increase in UA, CRP, TC, TG, LDLc, and VLDLc of RA patients when compared with healthy controls, as seen in Table I, while HDLc was significantly decreased in the RA patients in comparison to the control group. These results indicated a state of dyslipidemia and inflammation in RA disease.
Regarding dyslipidemia, the increase in circulating lipid concentrations may make RA patients at a higher risk for developing cardiovascular diseases [20]. These adipose tissues also secrete many adipokines including visfatin and chemerin that were not studied well in RA disease [21]. Adipokines secreted predominantly by WAT have potent modulatory effects on synovial, cartilage, bone and immune cells that are involved in the pathogenesis of RA [21]. Once chemerin is activated, it triggers rapid defenses in the body by directing dendritic cells and macrophages to the injured tissues and inflammation sites. Chemerin and its receptor form a complex involved in the regulation of the immune response which can contribute to both the onset and termination of acute inflammation [22]. Therefore, elevation of the chemerin level can directly favor inflammation by recruiting immune system cells. Chemerin also increased the expression and secretion of inflammatory mediators to the inflamed spot [23].
Increased concentrations of this adipokine in adipose tissue lead to recruitment of immune cells to express more inflammatory mediators such as CRP, interleukin 6 (IL-6), and tumor necrosis factor α (TNF-α) [24], leading to exacerbation of the inflammation.
Several observations lead to the hypothesis that visfatin has a role in the pathogenesis of RA. Some studies reported upregulation of visfatin in active RA in response to proinflammatory stimuli, such as IL-6 [25]. Serum and synovial fluid visfatin levels are correlated with the degree of inflammation, with the severity of the disease, and with joint damage [26]. Visfatin inhibition significantly reduced the severity of the disease in the experimental model of collagen-induced arthritis [27]. Therefore, visfatin’s role in RA needs more clarification at the molecular level to find out the mechanism of action that may lead to more drug target studies as a tool for treatment of RA.
To prevent the limitation in the effectiveness of the detection of the studied parameters to diagnoses the RA disease, multivariate GLM analysis was used. This analysis depends on studying the detection limits of the studied parameters. The GLM analysis (Table II) showed a large effect of being RA patients on all measured parameters and excluding age and BMI as covariates. The largest effect was on CRP followed by chemerin and UA respectively, while visfatin showed a small effect size on the diagnosis of RA disease.
These results indicated the inflammatory nature of RA disease. RA is characterized by inflammation and the formation of atherosclerosis can be exacerbated and accelerated by systemic inflammation [28]. The inflammation occurs due to the effect of certain cytokines that play a vital role in joint destruction and increases cellular infiltration in the synovium through enhancing chemo- kine expression [29].
The correlation study shows many significant correlations among the measured parameters (Table III). The most important correlations were between chemerin and dyslipidemia parameters (increased TC, LDLc, VLDLc, and TG, while HDL-c decreased) and the duration of disease. These correlations may be due to many effects of chemerin on various biological processes involved in RA disease, which increased with the progression of the disease. Chemerin regulates adipogenesis, angiogenesis, and inflammation [30], which increased with the duration of RA. Furthermore, serum levels of this adipokine are associated with components of metabolic syndrome, including increased BMI, plasma TG level, and hypertension [31].
Another study revealed that in RA patients, the serum level of chemerin is increased and associated with more systemic inflammation rather than obesity [32]. These findings suggest chemerin as a valuable biomarker of the disease activity [32].
In the current study, there was also a significant positive correlation of chemerin with dyslipidemia parameters, especially HDLc, which reversed cholesterol transport, and prevented LDL oxidation, thus reducing its atherogenic potential. Chemerin plays a role in the regulation of enzymes responsible for lipid metabolism by reducing the accumulation of adenosine cyclic monophosphate (cAMP) and stimulated calcium release from adipocytes [33]. Moreover, other researchers have demonstrated a positive correlation between circulating visfatin levels and RA disease activity [34].
In our study, we recorded a positive correlation between chemerin and DAS28 (r = 0.243, p < 0.05) in addition to the expected dependence of the severity of disease with the CRP (r = 0.433, p< 0.001). But visfatin showed no statistically significant correlation with the severity of disease (DAS28). These different results may be due to the difference in the clinical characteristics, severity, and number of samples between the studies. There were a few studies about the effect of adipokine visfatin in RA which indicate a positive correlation between visfatin and inflammation markers, and elevated levels in RA patients when compared with control subjects [35].
A significant increase of other parameters in the present study is in agreement with many studies dealing with RA patients [36]. The results also indicate a significant difference between RA patients and the control groups in the chemerin/visfatin ratio. This gives another biomarker that can be used as a diagnostic factor since chemerin acts as a proinflammatory adipokine. Visfatin level was found to be an inflammatory marker that associates with RA disease independently of CRP and uric acid. Rho et al. [18] demonstrated that serum visfatin level was positively correlated with age, BMI and inflammation markers (CRP, TNF-α, and IL-6), with statistical significance in RA patients.
Other studies have shown associations between visfatin and other inflammatory markers [33–37]. In this study, another relationship was found between chemerin with CRP and UA, indicating a relationship with systemic inflammation. This, in part, may be due to the fact that inflammatory cytokines released by adipose tissue stimulate the synthesis of CRP in the liver, which was observed in inflamed tissues, in RA, and myocardium after infarction [38].
In addition to the studied biomarkers for RA, many other molecules were used as a diagnostic tool for the diagnosis of RA with no absolute cutoff values that can refer to the disease [39]. For studying the diagnostic accuracy of chemerin, visfatin and their ratio in the diagnosis of RA, ROC was constructed to obtain sensitivity, specificity, the area under the curve (AUC), of certain cut-off values of the biomarkers (Fig. 1 and Table IV). The receiver operating curve was chosen because it is superior to other commonly used methods and takes into account the correlation between sensitivity and 1-specificity at the cut-off values.
The results showed relatively good sensitivity and specificity of chemerin in the diagnosis of RA (sensitivity = 88.1% and specificity = 75.9%) in comparison with visfatin and chemerin/visfatin ratio. In comparison with other routine biomarkers used for diagnosis of RA, the sensitivity and specificity of anti-cyclic citrullinated peptide antibody were 67% and 95%, respectively, and for IgM rheumatoid factor, the values were 69% and 85%, respectively [40]. This comparison indicated the ability of chemerin to diagnose RA efficiently, but this diagnosis, due to relatively small specificity, may interfere with other inflammatory disorders. However, as an adjuvant with other diagnostic parameters, chemerin may represent a useful addition in the diagnosis of RA.
Conclusions
In conclusion, chemerin and visfatin levels can be used as inflammatory biomarkers of RA patients. In particular, chemerin and visfatin seem to be linked to RA disease when adjusted to other cofounders. The best biomarker is chemerin (sensitivity = 88.1%, specificity = 75.9%, at cut-off concentration = 187.88 ng/ml) in comparison with visfatin (sensitivity = 64.4%, specificity = 58.6%, at cut-off concentration = 39.02 ng/ml), and chemerin/visfatin ratio (sensitivity = 66.1%, specificity = 65.5%, at cut-off concentration = 5.03 ng/ml). More studies on a large sample are required to confirm the diagnostic ability of these biomarkers.
Limitations of the study
The first limitation is the small sample size of the study. Therefore, research studies with a much larger sample size would be required to ensure appropriate generalization of the findings of the study. The second limitation is the significance of the inter-assay CV of the ELISA kits, with the range 3.97–6.52% for chemerin and 10.83–11.81% for the visfatin kit.