
Introduction
Medical diagnostics has been developing very dynamically over the last three decades. This is particularly true for diagnostic imaging. The role of ultrasound (US) and magnetic resonance imaging (MRI) in rheumatology has been increasingly important. Currently, it is difficult to imagine the modern diagnostic process for rheumatoid arthritis (RA) without the evaluation of synovitis. Synovitis is considered to be the core component of RA and at the same time it has a significant influence on therapeutic decisions [1–3]. Precise evaluation of synovitis allows one to avoid unnecessary use of biologicals, which may cause adverse events such as circulatory insufficiency exacerbation or onset of neuropathy [4, 5].
Despite the lack of diagnostic imaging in the current American College of Rheumatology/European League Against Rheumatism (ACR/EULAR) 2010 classification criteria, there is a general consensus regarding its high diagnostic utility [1]. However, before diagnostic imaging is included in new diagnostic criteria, the results of the current research need to be subjected to systematic review and appropriate interpretation with regard to the currently used disease activity scales such as the Disease Activity Score (DAS, DAS28), Clinical Disease Activity Index (CDAI) or Simplified Disease Activity Index (SDAI).
Early RA usually involves lesions not evident on physical examination or a radiograph. These are subclinical lesions [6]. It is associated with a significant drop in sensitivity of the currently used classification criteria, particularly in the first weeks of the disease [1]. For this reason, US, both greyscale (GSUS) and power Doppler (PDUS), and MRI are often used. They make it possible to evaluate lesions which may initially be subclinical, i.e. synovial thickening, joint effusions, bone erosions, hypervascularization or active inflammation.
However, diagnostic imaging is not the only means to increase the sensitivity and specificity of the currently applied criteria. Another non-invasive examination method with no significant contraindications is fluorescence spectroscopy, which has been used in medical diagnostics for many years [6–9].
It is also useful in rheumatology, for instance, for the assessment of comorbidity risks such as diabetes or cardiovascular diseases (CVD) [10].
Fluorescence
The phenomenon of fluorescence was first described in the 19th century by George Stokes. However, it was not until the 20th century that it was fully accounted for and precisely understood. Aleksander Jabłoński, a Polish physicist, made a significant contribution to its contemporary description. A diagram illustrating the phenomenon of fluorescence has been named the “Jablonski diagram” in his honour.
Molecules, or their electrons to be precise, have the ability to absorb energy carried by photons. The phenomenon of absorption is governed by certain laws whereby in order for a molecule to be able to absorb a photon it is necessary for the photon to have energy equal to the difference of energies between the consecutive energy levels in the molecule. It is only once this condition is met that the photon can be absorbed by an electron. Obviously, different molecules have different energy intervals. Therefore, a photon of a given energy will not be absorbed by all molecules. This is the key property of molecules from the point of view of fluorescence spectroscopy. This method makes it possible to distinguish between different molecules: different molecules absorb light of different energy, thanks to which their fluorescence spectra differ from one another.
After absorbing energy an electron changes from its ground state to a higher energy level, i.e. an excited state. Excited states are not stable, and therefore after some time an electron returns to its ground state and radiates the energy absorbed earlier in the form of light. This process is called fluorescence.
Due to the fact that the energy levels of an electron are divided into sublevels, the electron does not radiate the same amount of energy as it has absorbed. If it was the same, it would not be possible to distinguish between the light of emission from the light of absorption. Some of the energy of the electron in the excited state is lost in a non-radiative way, i.e. without light emission. Energy can be radiated, e.g. as heat or as a result of collisions with other molecules. Therefore, as the electron returns to its ground state, it emits light with different, lower energy. This effect is called Stokes shift to honour the scientist who observed it for the first time. At a macroscopic scale this effect is visible as light colour change: absorption light has a different colour from emission light.
The phenomenon of emission, depending on the temporal difference between the process of absorption and emission, can be divided into phosphorescence lasting seconds and fluorescence lasting nanoseconds. It is associated with molecular structure and the probability of transitions between different energy levels.
The duration of light emission, the energy of absorption and that of emission play a key role in the process of molecule identification. For this reason, fluorescent spectroscopy has wide application and can provide a significant amount of information about both the molecule itself and its environment.
Time: a practical factor
Quick RA detection and treatment efficacy monitoring in routine clinical practice in particular must also be evaluated in terms of the time that a clinician can spend for each patient. It is one of the reasons why the DAS score has been modified to become DAS28. It is quicker to evaluate a smaller number of joints, although it provides less information on disease activity.
For diagnostic imaging time is also one of the key elements determining the possibility of using it in routine clinical practice. It should be made clear that clinical trials and scientific research have their own peculiarities. They allow one to devote much more time to a patient than is possible under normal conditions.
The performance and evaluation of radiographs is not time-consuming. However, this examination has prognostic value only and cannot be used for disease activity evaluation at a given visit [11].
Greyscale/power Doppler and MRI make it possible to assess disease activity; however, the duration of their performance and the evaluation of the images are often too long. For this reason, a large body of research aims to identify the minimum number of joints that can be considered representative for disease activity evaluation [1, 12]. This is particularly true for US, in which the number of examined joints ranges between a few dozen and one, as is the case for the SAS 1 score [13].
For this reason, the fluorescence spectroscopy examination seems to be an interesting alternative. Due to the very nature of the phenomenon the duration of such a procedure is very short. Consequently, fluorescence spectroscopy can be performed during routine patient visits.
Obviously, access to the necessary equipment is a separate issue altogether. However, from a practical point of view, the purchase of a device which guarantees conducting a test with very high sensitivity and specificity seems to be a smaller problem than finding enough time for every patient to perform an US scan, not to mention the time to be found in an MRI laboratory schedule for routine examination of at least the joints of the hand.
One of the primary problems for fluorescence spectroscopy in medical diagnostics is the location of the area to be examined. The deeper in the body it is located, the more difficult the examination is. It is associated with low penetrability of light through the skin [14]. This is particularly true for light close to the ultraviolet range: for evolutionary reasons the skin represents a natural barrier to such light. For this reason, light with a longer wavelength, even close to that of infrared, is often used in studies. For waves of that length the surface layer of the skin has a significantly lower absorption coefficient than for light close to ultraviolet.
It is not a significant problem in the case of RA, particularly in the evaluation of small joints of the hand. These joints are located close enough for it to be possible to excite the molecules present in them and record the fluorescence signal [14].
Fluorescence optical imaging (FOI) is a relatively new method in medical diagnostics; however, due to the ease of its use and the lack of contraindications it is well described and has been used in many scientific studies evaluating synovitis [14–16].
Diagnostic imaging often involves the use of contrast agents in order to obtain better image quality or visualise lesions in the tissues under examination, for example, in cancer diagnosis. Fluorescence spectroscopy is similar in that a characteristic molecule is introduced into the system under examination, which can be regarded as the equivalent of contrast agents in diagnostic imaging.
The introduction of a fluorescent molecule into the system under examination has a number of advantages: one can select a particular molecule so that the light which is not used for molecule excitement is not absorbed by other molecules occurring naturally in the examined system, such as proteins. As a result, the observed fluorescence signal will originate only from the molecule introduced. Some of the fluorescent molecules can accumulate only in certain areas, which is similar to the contrast agent used in positron emission tomography (PET) [17].
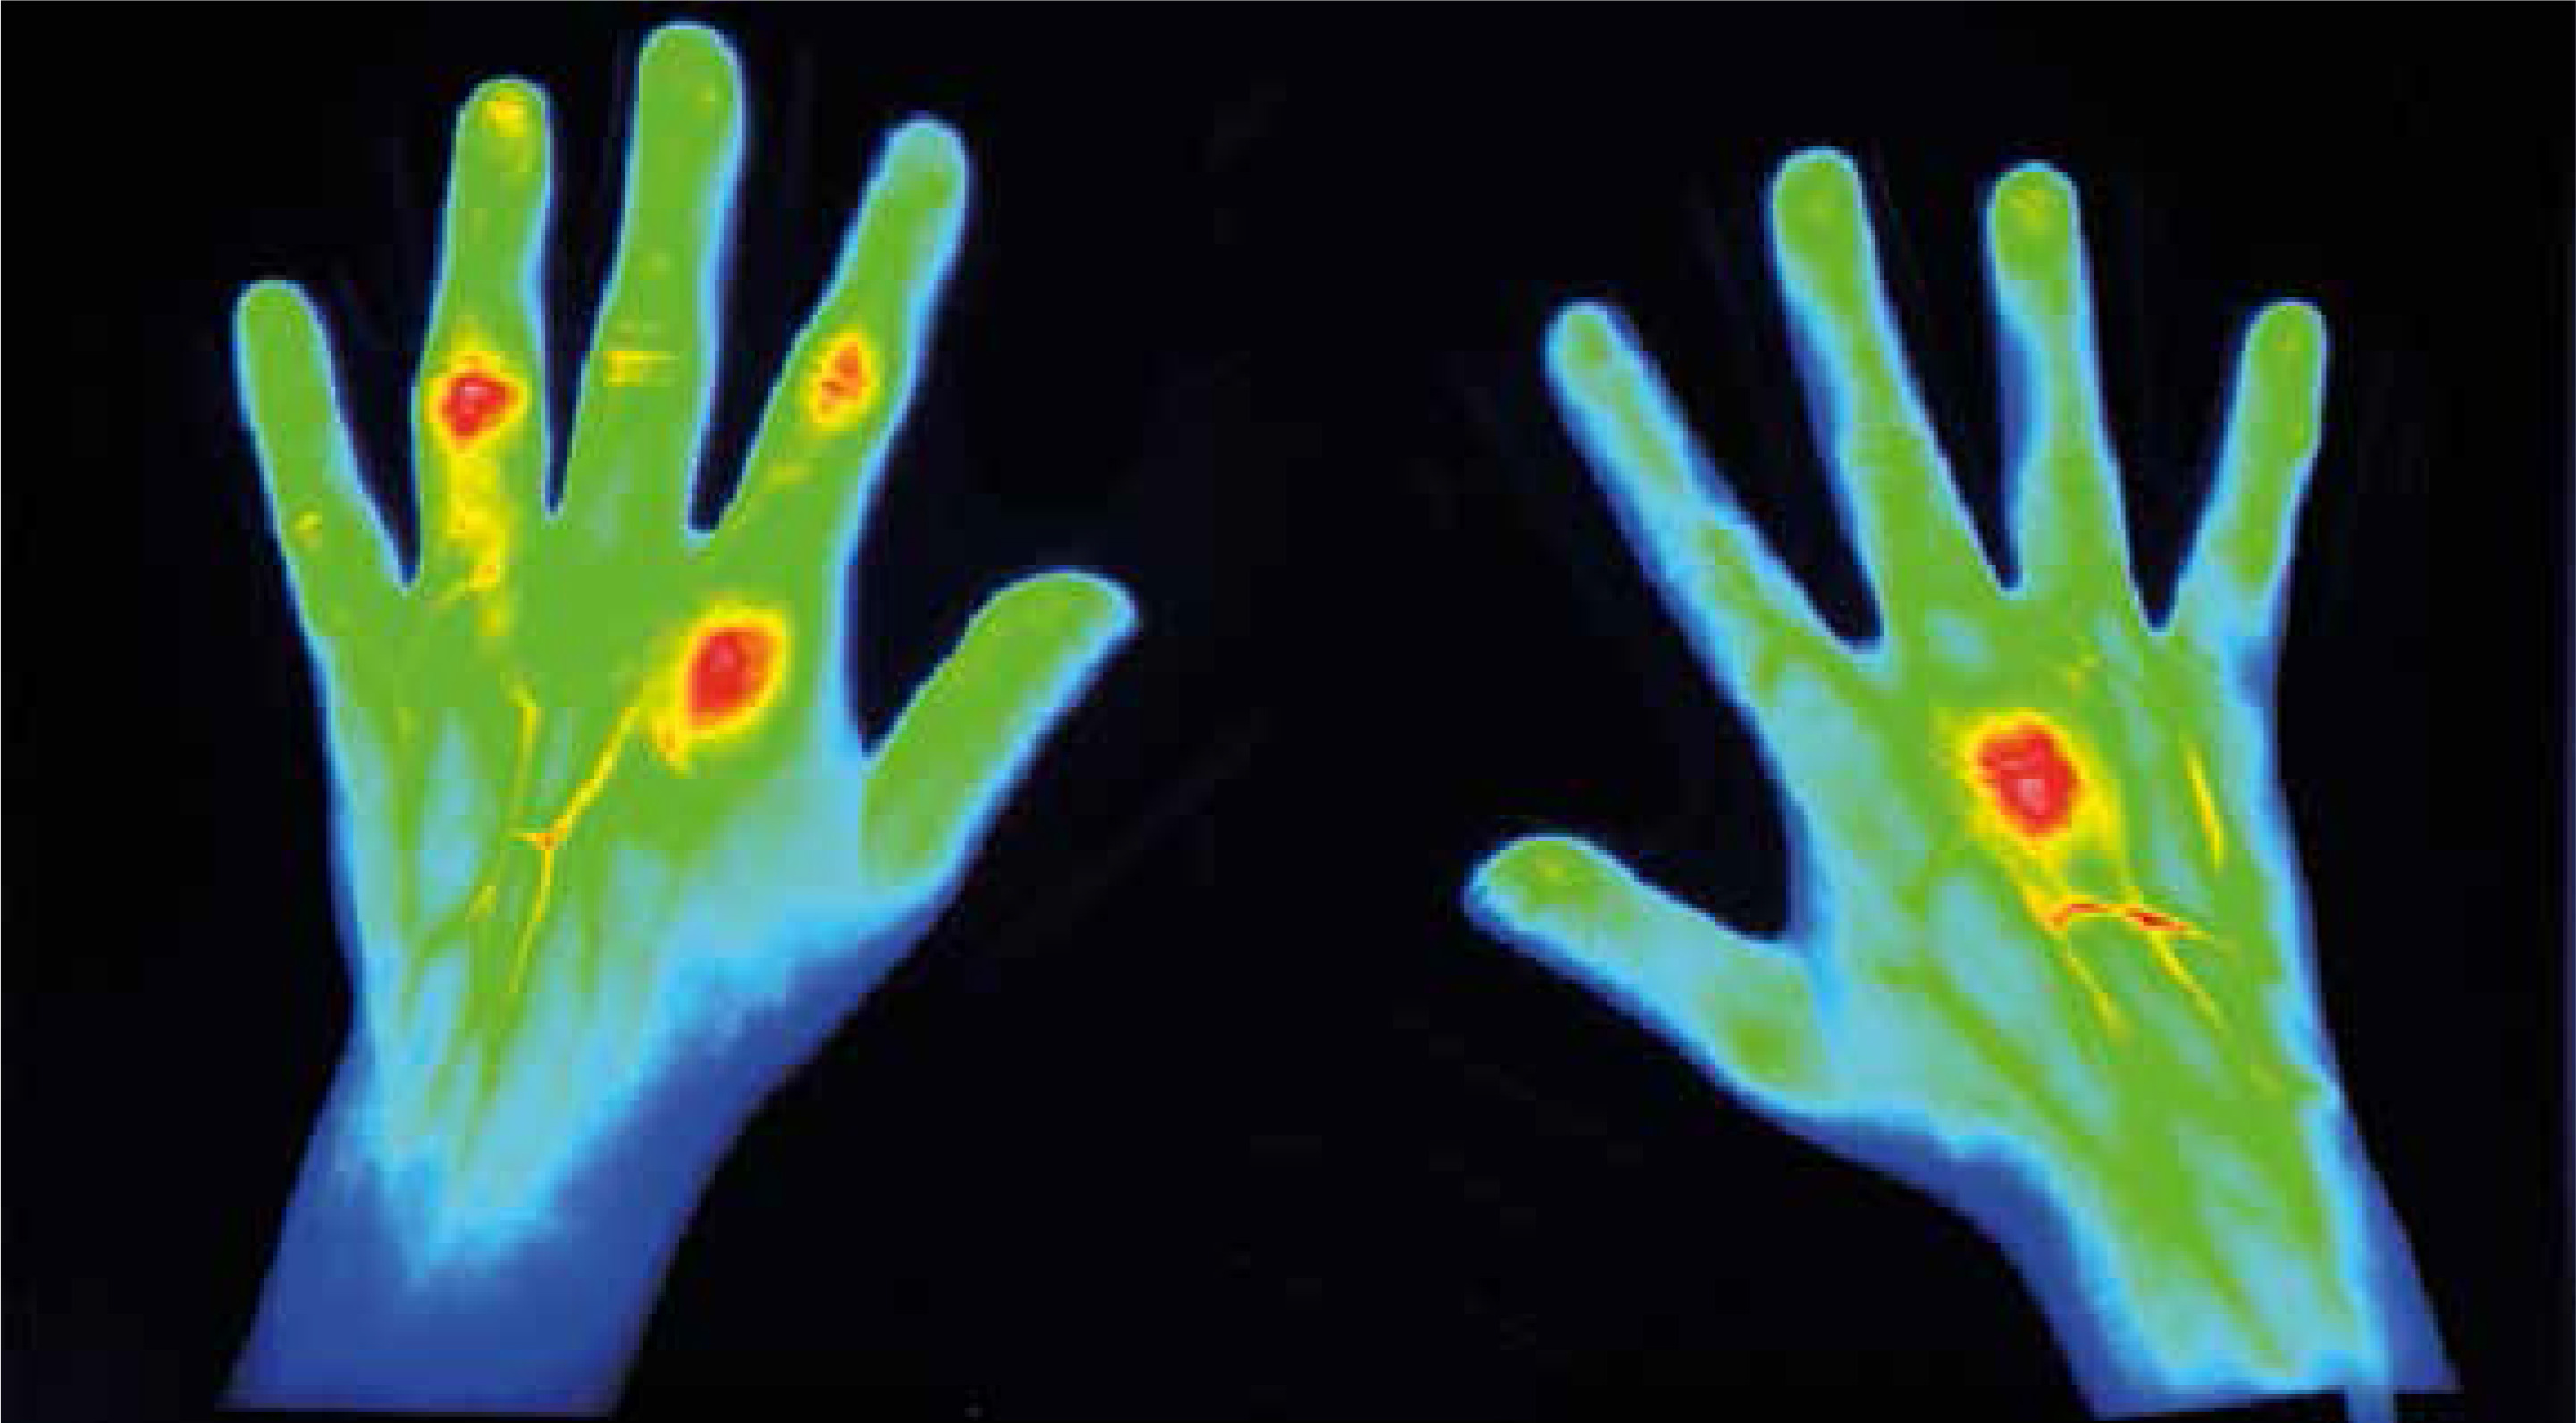
For this reason, the areas where fluorescence is present can be easily noticed and in this way joints with active synovitis can be identified (Fig. 1). In time-resolved fluorescence spectroscopy tissue lesions can also be visible as changes in the duration of molecule life in an excited state [18].
Fig. 1
59-year-old female patient with longstanding rheumatoid arthritis (RA). A DAS28 score of 5.3 proved profound clinical activity of RA. Focal contrast enhancement is observed in right MCP III as well as in left MCP II, PIP II, PIP IV, and less profound PIP III left. All these joints were clinically swollen and tender, except left PIP III, which clinically showed only swelling (thanks to courtesy of Xiralite GmbH).
The rheumatoid hand in the light of fluorescence
Schäfer et al. [14] conducted a study on 18 patients using the commercially available Xiralite X4 device (Mivenion GmbH, Germany). They assessed the consistency between the results obtained using FOI, US and MRI.
The US examination (15 MHz linear transducer) was used to assess the following joints: the wrist, metacarpophalangeal (MCP) II–III, proximal interphalangeal (PIP) II–III and metatarsophalangeal II and V joints. Magnetic resonance imaging (1.5 T) focused on the evaluation of the carpal and MCP joints. Both procedures were used to evaluate only the dominant hand and US additionally involved the evaluation of the dominant foot.
Fluorescence optical imaging was used to evaluate both hands. The hands were placed on a preformed hand rest. Approximately 10 seconds after the start of the examination the fluorescent dye indocyanine green (ICG), approved by the US Food and Drug Administration (FDA), was administered. Subsequently, the time of ICG degradation in the joints and of fluorescence disappearance, which is usually approximately four minutes, was observed. Subsequently, a computer program was used for automatic analysis of the data obtained during measurement. The fluorescence ratio (FLRA) was determined for each of the evaluated joints. FLRA is the ratio between the fluorescence signal in the examined joint and the fluorescence signal in the eponychium of the index finger, which, on the basis of the current knowledge, is an anatomical area which is not affected by inflammation associated with RA [14].
Magnetic resonance imaging is considered by the authors of the study to be the gold diagnostic standard. The sensitivity of FOI in relation to MRI ranged from 42% (95% CI: 23–62%) for MCP to 100% (95% CI: 57–90%) for PIP.
It is worth taking note of the fact that FLRA is a quantitative assessment, which ensures a much higher repeatability of results than semi-quantitative methods used in US, for example. For this reason, the results of FOI are not significantly affected by the experience and skills of the examiner. It is a method which guarantees high repeatability of the results, and due to automatic data analysis it does not require much time for evaluation, as is the case with MRI.
Fluorescence optical imaging is sensitive enough in the evaluation of synovitis in that it makes it possible to detect subclinical synovitis, as do US and MRI [14]. It seems that the detection of subclinical inflammatory lesions is a necessity for new diagnostic techniques used in RA patients. A number of scientific studies show that subclinical lesions may be a prognostic factor for disease activity and contribute to better monitoring of disease activity and making appropriate therapeutic decisions [3, 19, 20].
Considering the fact that a characteristic feature of active RA is an increase in the vascularisation of the synovial membrane, in the future FOI may be a very useful tool for disease activity monitoring [14, 15]. This is supported by the short duration of the procedure, quick analysis of the results and the possibility to visualise synovitis using ICG fluorescence.
The study by Schäfer et al. [14] is also valuable in the sense that, according to our and the author’s best knowledge, it was the first FOI study to use a quantitative method. Studies performed earlier which were based on semi-quantitative methods were characterised by a much lower specificity [14].
Krohn et al. [15] performed a very interesting study using FOI. The study included only patients with early RA. In total, 31 patients participated in the study and the mean duration of disease was 5.6 months. The following joints were evaluated: MCP II-V and PIP II–V in FOI, MRI, GSUS and PDUS procedures.
The highest consistency was found with PDUS. The authors explain this by the fact that both FOI and PDUS evaluate hypervascularisation of the joints. When high synovial perfusion is present, a strong PD signal and high ICG concentration are observed, which results in a high fluorescence signal intensity. In contrast, GSUS is used to evaluate morphological changes such as synovial hypertrophy, which does not always have to be accompanied by active synovitis. For this reason, the consistency between FOI and GSUS was low.
Magnetic resonance imaging can be used to evaluate both vascularisation (active inflammation) and morphological changes. Compared to MRI, the sensitivity and specificity of FOI was higher than that of GSUS, but lower than PDUS. MRI can be considered the gold standard since it makes it possible to assess both morphological changes and active synovitis. The discrepancies between FOI and MRI are associated to a large extent with the large difference in the time of data collection between the two methods.
Magnetic resonance imaging lasts much longer and the presence of a contrast agent is much longer than the half-life of CGI, which plays the role of a contrast agent in FOI. Further studies on the time of CGI administration are necessary in order to increase the sensitivity and specificity of FOI and achieve the highest possible enhancement of the fluorescence signal [15].
A significant limitation of studies on the use of FOI is the very small groups of patients [14–16]. It is also important to take note of the fact that despite a high rate of development FOI is still a new examination method which requires the improvement of a number of technical aspects. Particular attention needs to be paid to the speed of fluorophore administration into the body and the appropriate time for starting the examination.
The results of different studies are inconsistent since the authors also used different ways of data analysis: semi-quantitative or quantitative. Undoubtedly, an issue which supports the use of FOI is the agreement on the use of the same fluorophore, which will make it relatively simple to compare the results from various centres if the same study protocols are used.
Conclusions
The introduction of new diagnostic methods always takes a time. Fluorescence spectroscopy is a very sensitive study tool; however, its main applications are associated with research in physics, chemistry and other closely related fields. In the case of medical research, the lack of wide access to the highly specialized equipment is a significant limitation to conducting wide-scale studies.
It is difficult to assess on the basis of the studies performed to date whether FOI can become a diagnostic standard in the future for disease activity monitoring in patients with RA. This method is certainly supported by the short duration of the procedure and the lack of any contraindications.
FOI also gives much hope in terms of its high sensitivity and specificity compared to PDUS, which is currently one of the most commonly performed examinations allowing one to assess synovitis. It seems, however, that at least due to the accessibility of equipment FOI should be characterised by a similar sensitivity and specificity as MRI. MRI is associated with higher sensitivity than PDUS. Therefore, one cannot expect FOI to supersede PDUS if it does not have higher sensitivity.
It is an open question how much the sensitivity and specificity of FOI can be increased in the detection of synovitis. At the current state of knowledge it is certainly necessary to conduct further studies, particularly regarding the algorithm for fluorophore administration and the final data analysis.
However, it should be remembered that FOI, even with 100% sensitivity and specificity, will never replace imaging diagnostics. Monitoring of an RA patient’s condition, in addition to inflammation assessment, must also involve evaluation of morphological changes to anatomical structures, which is not possible with FOI.