
Introduction
Systemic lupus erythematosus (SLE) is a complex autoimmune disease affecting many organs. Metabolic and functional changes will cause a peripheral tolerance failure and enhance T cell differentiation into pro-inflammatory phenotypes of T cells and aggravate the condition [1].
The ongoing process of chronic immune activation and pro-inflammatory phenotypes during the natural history of the disease in SLE can lead to immunosenescence, which generally only happens in the elderly.
Immunosenescence is defined as the dynamic changes in the innate and adaptive immune systems and is associated with a low-grade inflammation called inflammaging during the aging process. Inflammaging is also related to cardiovascular, neurodegenerative, or cancer in the elderly [2].
The aging of the immune system causes the immune cells to express several senescence markers, such as CD57 and KLRG1 (killer cell lectin like receptor G1). The CD57 antigen and KLRG1 are markers commonly defined by the terminally differentiated T cells [3]. These terminally differentiated T cells will express pro-inflammatory cytokines, such as interleukin-1α, interleukin-6, tumour necrosis factor-α (TNF-α), and one of the most secreted cytokines: IFN-γ [4].
The CD57 antigen expression in the lymphocyte lineage, especially in the CD4+ and CD8+ T cells, is associated with clonal exhaustion and autoimmunity. T cells expressing CD57 will become highly cytotoxic with shortened telomeres, and they express the NK cell receptor [5]. The killer cell lectin-like receptor G1 expression marks the terminally differentiated T cells, which still actively secretes cytokines but can no longer proliferate after antigen stimulation, with a shorter lifespan [6].
In previous studies, several autoimmune diseases have been characterized by an increase of CD57-expressing T cells in the peripheral blood, including Graves’ disease, ankylosing spondylitis, and rheumatoid arthritis. This cell appears to be associated with a more severe disease manifestation [7]. Meanwhile, CD8+KLRG1+ T cells are associated with an inadequate response to the treatment in early RA patients [8].
Immunosenescence will render patients more vulnerable to infections, malignancies, cardiovascular diseases, and other organ damage caused by immune system impairment [9]. Previous studies show that immunosenescence increases morbidity and mortality from infections and lessens response to immunologic challenges, such as vaccination [10].
In addition, immunosenescence will cause a decrease in tumour surveillance, which might be why the incidence of malignancies increases with aging. Moreover, immunologic aging can impair the immune tolerance mechanisms, leading to the risk of autoimmune disorders [11].
Consequently, these conditions are responsible for higher mortality and morbidity rates from normally survivable diseases. Despite that, the association between the immunosenescence, especially the role of senescent T cells that express the CD57 or KLRG1 molecules in patients with SLE, has never been discussed before.
Previous studies have not concluded a direct correlation between immunosenescence with SLE disease activity index. Therefore, this study aimed to evaluate further the correlation between the percentage of senescent T cells that express the CD57 and KLRG1 molecules with the clinical manifestations and the disease activity in our SLE patients.
Material and methods
Study design and subjects
The study design was a cross-sectional study conducted in Dr. Saiful Anwar General Hospital, Malang, Indonesia. The subjects were female SLE patients, aged 16–45 years, who were classified with the Systemic Lupus International Collaborating Clinics (SLICC) 2012 criteria. Patients were referred to the Rheumatology outpatient clinic of Dr. Saiful Anwar General Hospital, Malang, Indonesia. Patients with severe infection (TBC, pneumonia, or sepsis), pregnant or lactating, or with severe renal impairment were excluded from this study.
The characteristics of the subjects are shown in Table I. For the 53 patients, the mean age was 28.3 ±6.6 years, and the mean age of onset was 24 ±5.9 years. All patients received the medications according to the SLE guidelines, including glucocorticoids, hydroxychloroquine, azathioprine, cyclophosphamide, or mycophenolate mofetil (MMF).
Table I
Baseline characteristics of subjects (n = 53)
Healthy individuals were also recruited as a control group, which consisted of women matched by age to the study group (16–45 years old). All enrolled subjects had signed an informed consent form. All the protocols in this study were already approved by the Ethical Committee of Dr. Saiful Anwar General Hospital, Malang, Indonesia (ethical no. 400/120/K.3/302/2017).
Data collection
Primary data were obtained through history taking and direct examination of the subjects. The data consisted of demographic data (identity, age, address, occupation, or race) and clinical data (disease onset, symptoms at diagnosis, presenting symptoms, hospitalization frequency, blood transfusion history, medication history, or previous laboratory data). At the time of visit, all subjects had blood samples taken, which were measured for complete blood count, urinalysis, liver and renal function tests, C-reactive protein (CRP), erythrocyte sedimentation rates (ESR), complements, and anti-dsDNA levels.
The systemic lupus erythematosus disease activity index score was measured when patients visited the clinic, and it was further divided into mild (<6), moderate (6–12), and severe (>12). The active condition of SLE was defined as SLEDAI score ≥3. Secondary data were obtained from the patients’ medical records. The data consisted of onset and duration of SLE, present and prior medication, blood transfusion history, hospitalization history, and any other previously documented comorbidities.
Measurement of CD57 and KLRG1 expression by flowcytometry
All subjects had 10–15 ml of vein blood taken, then peripheral blood mononuclear cells (PBMCs) were isolated from peripheral blood using Lymphoprep™ (Stemcell Technology) by centrifugation (1600 γ for 30 minutes). The formed PBMC layer was taken slowly and rewashed with 10 ml phosphate buffer saline (PBS). The supernatant was discarded and centrifuged at room temperature (1200 γ for 30 minutes). Isolate peripheral blood mononuclear cells were stained with FITC anti-human CD3 antibody, PerCP anti-human CD4 antibody or PerCP anti-human CD8 antibody, and PE anti-human CD57 antibody.
In addition, the other pellets were stained with FITC anti-human CD3 antibody, and PerCP anti-human CD4 antibody or PerCP anti-human CD8 antibody, and anti-human KLRG1 IgG-FITC (all immunoassays were from BioLegend). CD4+CD57+, CD8+CD57+, CD4+KLRG1+, and CD8+KLRG1+ T cells were measured in 10,000 cells by the flow cytometry (BD FACSCalibur, BD Bioscience).
Measurement of IFN-γ serum level by ELISA
The IFN-γ serum level was measured using an ELISA kit Elabscience. Serum was diluted and then incubated for 30 minutes. After that, wash buffer and HRP conjugate were added. Results were read with a microplate reader (Stat Fax 303 Plus microplate reader, with a minimum detection level of 9.38 pg/ml).
Data analysis
The comparison of the CD4+ CD57+, CD8+ CD57+, CD4+ KLRG1+, and CD8+ KLRG1+ T cells between the patients with active and inactive disease were assessed using the Mann-Whitney U test. CD4+ CD57+, CD8+ CD57+, CD4+ KLRG1+, CD8+ KLRG1+ T cells, IFN-γ serum level, and SLEDAI score correlations were analysed using the Spearman test.
The association between variables that were transformed into normally distributed was calculated by linear regression analysis. Parametric data were shown as means with standard deviation (SD), and nonparametric data were shown as medians (interquartile range). P < 0.05 was considered significant. Statistical tests and tables were made using IBM SPSS for Windows version 20.0.
Results
Subjects’ characteristics
The median score of SLEDAI was 6 (4–16); 12 patients (22.6%) had inactive disease and 41 others (77.3%) had active disease with a SLEDAI score ≥ 3.
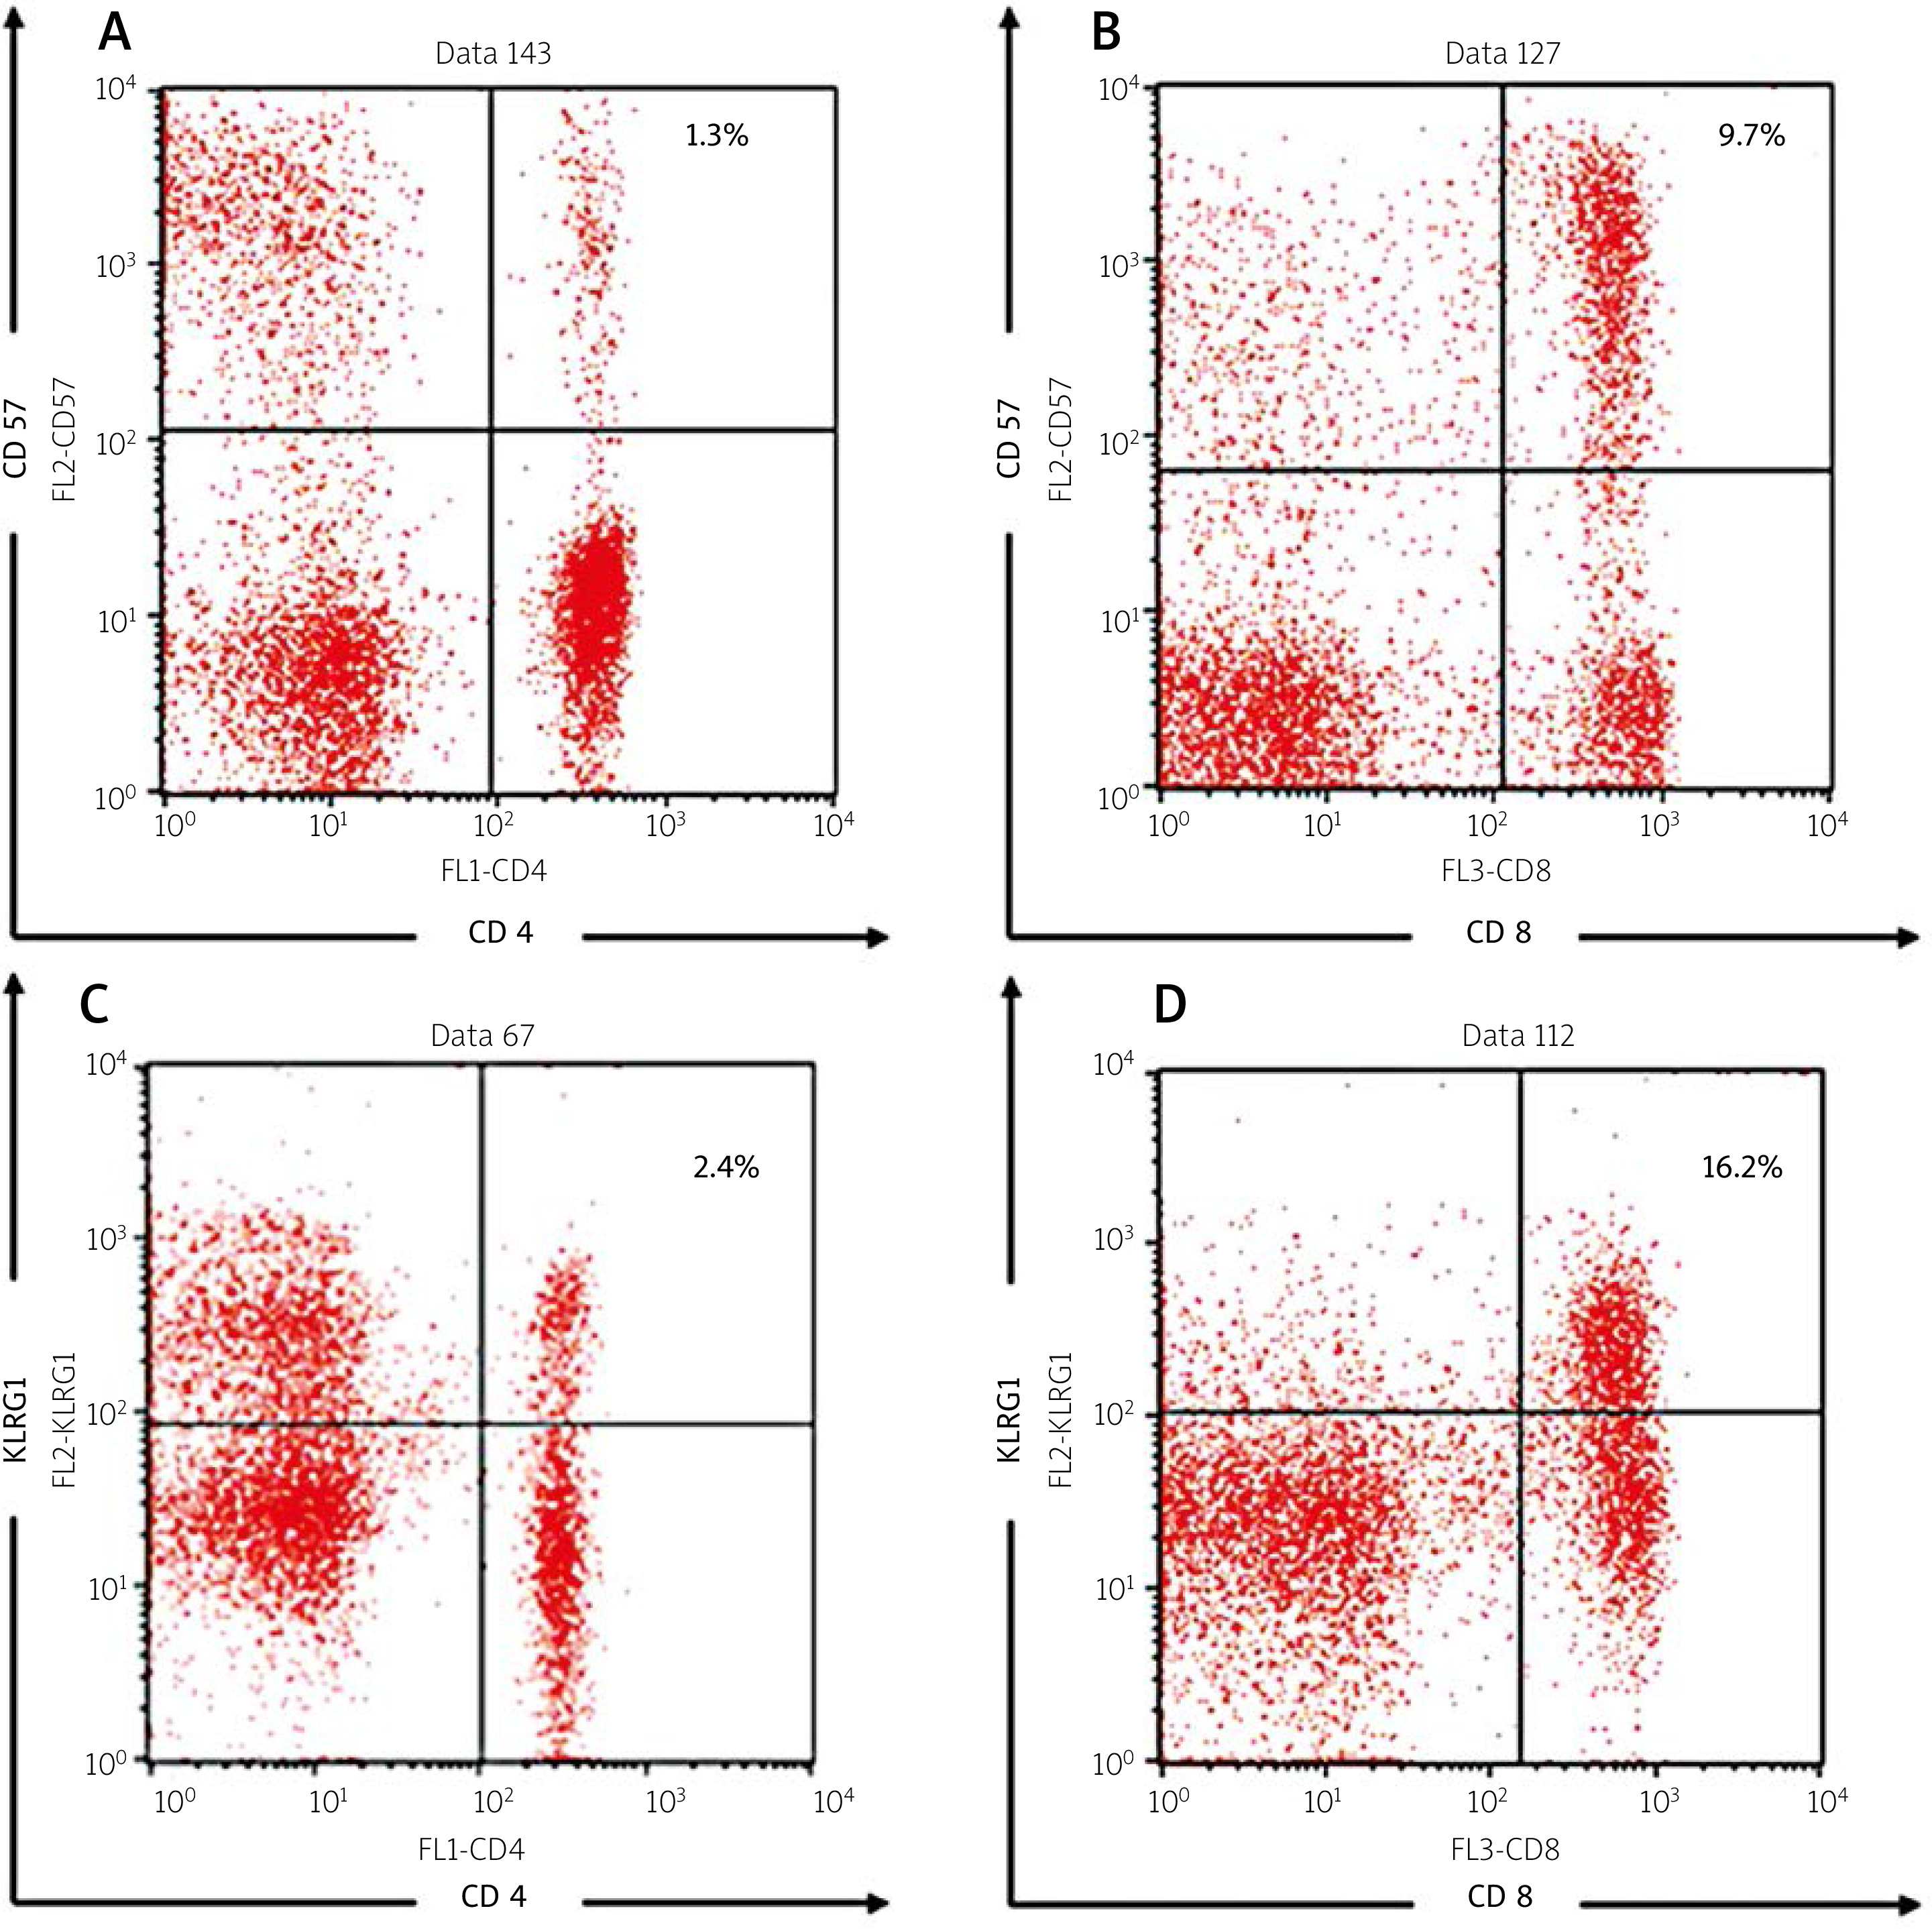
In addition, 17 patients (32.1%) had severe disease activity. Most of the patients had renal manifestations (45.3%) and arthritis (32.1%). The representative figures of the senescent T cells are shown in Figure 1.
Fig. 1
Representative figures of flowcytometry analysis, including the following: CD4+ CD57+ (A), CD8+ CD57+ (B), CD4+ KLRG1+ (C), CD8+ KLRG1+ T cell percentages (D).
Our results indicate that the median and mean percentages of the senescent T cells from the SLE patients were higher compared to the healthy controls (shown in Table II). The median percentages of CD4+KLRG1+, CD8+CD57+, and CD8+KLRG1+ were significantly higher compared to the healthy controls (p = 0.000 for all parameters). The percentages of CD4+CD57+ were higher in the SLE group although not statistically significantly (p = 0.108). On the other hand, the median level of IFN-γ was markedly higher in the SLE group compared to the healthy controls (193.1 [139.1–225.1] pg/ml vs. 6.2 [5.3–8.9] pg/ml, p = 0.000 as shown in Table II).
Table II
Comparison of the immunosenescence markers between healthy controls and systemic lupus erythematosus patients
| Variable | Healthy controls (n = 53) | SLE patients (n = 53) | p-value |
|---|---|---|---|
| CD4+CD57+ [%] | 1.0 (0.4–1.4) | 1.2 (0.6–2.8) | 0.108 |
| CD4+KLRG1+ [%] | 0.3 (0.1–0.5) | 3.1 (1.3–5.5) | 0.000* |
| CD8+CD57+ [%] | 2.4 ±2.0 | 11.6 ±7.1 | 0.000* |
| CD8+KLRG1+ [%] | 0.3 ±0.1 | 13.7 ±7.5 | 0.000* |
| IFN-γ levels [pg/ml] | 6.2 (5.3–8.9) | 193.1 (139.1–225.1) | 0.000* |
Comparison of the senescent T cell percentages and IFN-γ according to the clinical manifestations
The comparisons of the senescent T cell percentages and IFN-γ levels according to the clinical manifestations are shown in Table III.
Table III
Comparison of immunosenescence markers according to clinical manifestations of systemic lupus erythematosus patients
| Clinical manifestations | CD4+CD57+ | CD8+CD57+ | CD4+KLRG1+ | CD8+KLRG1+ | IFN-γ levels | |||||
|---|---|---|---|---|---|---|---|---|---|---|
| Value [%] | p-value | Value [%] | p-value | Value [%] | p-value | Value [%] | p-value | Value [pg/ml] | p-value | |
| Neuropsychiatric | ||||||||||
| Yes | 5.0 (1.9–7.8) | 0.002* | 15.8 ±8.6 | 0.134 | 8.9 (4.9–15.1) | 0.023* | 21.8 ±6.9 | 0.004* | 54.9 (5.4–124.4) | 0.328 |
| No | 0.5 (1.0–2.3) | – | 11.1 ±6.8 | – | 2.8 (1.3–4.9) | – | 12.6 ±6.9 | – | 8.9 (5.–40.7) | – |
| Vasculitis | ||||||||||
| Yes | 1.8 (0.6–4.1) | 0.238 | 14.8 ±6.1 | 0.039* | 3.5 (1.4–8.8) | 0.211 | 15.3 ±5.6 | 0.335 | 9.5 (6.4–101.3) | 0.186 |
| No | 1.1 (0.5–2.6) | – | 10.5 ±7.2 | – | 2.8 (1.2–4.9) | – | 13.1 ±8.1 | – | 8.2 (4.9–44.4) | – |
| Arthritis | ||||||||||
| Yes | 1.3 (0.7–3.3) | 0.282 | 14.2 ±6.8 | 0.077 | 2.4 (1.3–5.4) | 0.523 | 14.1 ±6.7 | 0.771 | 8.9 (5.6–39.3) | 0.812 |
| No | 1.1 (0.4–2.3) | – | 10.5 ±7.0 | – | 3.7 (1.3–5.4) | – | 13.4 ±7.9 | – | 8.4 (5.2–101.3) | – |
| Nephritis | ||||||||||
| Yes | 1.3 (0.7–3.7) | 0.180 | 13.9 ±6.9 | 0.031* | 3.7 (1.6–10.4) | 0.095 | 15.3 ±7.2 | 0.157 | 9.5 (5.7–103.9) | 0.192 |
| No | 1.1 (0.4–1.9) | – | 9.7 ±6.8 | – | 2.4 (1.3–4.8) | – | 12.3 ±7.6 | – | 7.9 (5.2–30.7) | – |
| Mucocutaneous | ||||||||||
| Yes | 1.2 (0.7–2.8) | 0.184 | 13.2 ±7.8 | 0.124 | 4.0 (1.7–8.8) | 0.032* | 15.8 ±7.6 | 0.045* | 9.5 (8.5–101.3) | 0.007* |
| No | 1.0 (0.4–2.2) | – | 10.2 ±6.2 | – | 2.4 (1.0–4.6) | – | 11.7 ±7.1 | – | 6.4 (4.5–17.4) | – |
| Serositis | ||||||||||
| Yes | 1.2 (0.6–3.5) | 0.792 | 11.4 ±6.8 | 0.647 | 4.9 (1.8–12.0) | 0.130 | 14.9 ±8.2 | 0.513 | 39.3 (7.3–123.3) | 0.052 |
| No | 1.2 (0.5–2.8) | – | 12.5 ±8.4 | – | 2.8 (1.3–4.9) | – | 13.3 ±7.4 | – | 8.4 (5.0–30.7) | – |
| Increased anti-dsDNA | ||||||||||
| Yes | 1.2 (0.6–3.2) | 0.282 | 11.5 ±6.9 | 0.802 | 3.7 (1.3–5.9) | 0.154 | 13.6 ±7.7 | 0.885 | 9.5 (5.4–81.2) | 0.064 |
| No | 1.2 (0.5–1.7) | – | 12.1 ±7.8 | – | 2.4 (1.3–3.2) | – | 13.9 ±7.1 | – | 6.3 (5.4–8.2) | – |
| Low Complement | ||||||||||
| Yes | 2.0 (1.2–4.9) | 0.007* | 14.7 ±6.9 | 0.010 | 3.2 (2.4–8.8) | 0.146 | 15.7 ±7.8 | 0.107 | 39.3 (8.2–122.2) | 0.013* |
| No | 0.8 (0.5–1.7) | – | 9.6 ±6.5 | – | 2.3 (1.2–5.1) | – | 12.3 ±7.1 | – | 7.0 (5.1–10.6) | – |
| Thrombocytopenia | ||||||||||
| Yes | 1.2 (0.3–4.9) | 0.858 | 15.7 ±8.4 | 0.235 | 8.0 (2.1–13.6) | 0.387 | 17.0 ±10.8 | 0.357 | 54.9 (6.5–111.8) | 0.547 |
| No | 1.2 (0.6–2.8) | – | 11.3 ±6.9 | – | 2.9 (1.3–5.3) | – | 13.4 ±7.3 | – | 8.9 (5.4–42.0) | – |
| Leukopenia | ||||||||||
| Yes | 1.2 (0.6–4.5) | 0.601 | 13.0 ±6.9 | 0.377 | 3.4 (1.3–10.4) | 0.496 | 12.5 ±7.5 | 0.505 | 9.5 (6.7–101.3) | 0.401 |
| No | 1.2 (0.5–2.8) | – | 11.1 ±7.2 | – | 2.8 (1.3–5.3) | – | 14.1 ±7.6 | – | 8.1 (5.4–42.0) | – |
The percentages of CD4+CD57+ T cells were statistically higher in the subjects with neuropsychiatric manifestations (5.0 [1.9–7.8]% vs. 0.5 [1.0–2.3]%, p = 0.002) and low complement (2.0 [1.2–4.9]% vs. 0.8 [0.5–1.7]%, p = 0.007). The percentages of CD8+CD57+ T cells were significantly higher in subjects with vasculitis (14.8 ±6.1% vs. 10.5 ±7.2%, p = 0.039) and nephritis (13.9 ±6.9% vs. 9.7 ±6.8%, p = 0.031). The percentages of CD4+KLRG1+ T cells were statistically higher in subjects with neuropsychiatric manifestations (8.9 [4.9–15.1]% vs. 2.8 [1.3–4.9]%, p = 0.032) and mucocutaneous manifestations (4.0 [1.7–8.8]% vs. 2.4 [1.0–4.6]%, p = 0.032). The percentages of CD8+KLRG1+ were significantly higher in subjects with neuropsychiatric manifestations (21.8 ±6.9% vs. 12.6 ±6.9%, p = 0.004) and mucocutaneous manifestations (15.8 ±7.6% vs. 11.7 ±7.1%, p = 0.045).
Lastly, subjects with mucocutaneous manifestations (9.5 [8.5–101.3] pg/ml vs. 6.4 [4.5–17.4] pg/ml, p = 0.007) and low complement levels (39.3 [8.2–122.2] pg/ml vs 7.0 [5.1–10.6] pg/ml, p = 0.013) had significantly higher IFN-γ levels.
Correlations between SLE manifestation and T cell percentage are shown in Table IV. We found that neuropsychiatric manifestation has a positive correlation with CD4+CD57+ (OR = 1.42, p = 0.012), CD4+KLRG1+ (OR = 1.21, p = 0.013), and CD8+KLRG1+ (OR = 1.23, p = 0.014) T cells. Nephritis has a positive correlation with CD4+CD57+ (OR = 1.09, p = 0.037) and CD4+KLRG1+ (OR = 1.19, p = 0.029) T cells. Serositis has a positive correlation with CD4+KLRG1+ T cells (OR = 1.14, p = 0.049).
Table IV
Correlation between immunosenescence markers and clinical manifestations from SLE patients
| Manifestation | T CD4+CD57+ | T CD8+CD57+ | T CD4+KLRG1+ | T CD8+KLRG1+ | ||||||||
|---|---|---|---|---|---|---|---|---|---|---|---|---|
| OR | 95% CI | p-value | OR | 95% CI | p-value | OR | 95% CI | p-value | OR | 95% CI | p-value | |
| Neuropsychiatric | 1.42 | 1.08–1.86 | 0.012* | 1.09 | 0.96–1.24 | 0.143 | 1.21 | 1.04–1.41 | 0.013* | 1.23 | 1.04–1.45 | 0.014* |
| Vasculitis | 1.16 | 0.94–1.43 | 0.169 | 1.09 | 0.99–1.20 | 0.057 | 1.10 | 0.97–1.24 | 0.116 | 1.04 | 0.95–1.13 | 0.330 |
| Arthritis | 1.00 | 0.81–1.23 | 0.975 | 1.08 | 0.99–1.17 | 0.081 | 0.97 | 0.85–1.10 | 0.650 | 1.01 | 0.93–1.09 | 0.766 |
| Nephritis | 1.21 | 0.95–1.54 | 0.108 | 1.09 | 1.00–1.19 | 0.037* | 1.19 | 1.01–1.40 | 0.029* | 1.06 | 0.98–1.14 | 0.158 |
| Mucocutaneous manifestation | 1.21 | 0.95–1.54 | 0.119 | 1.07 | 0.98–1.15 | 0.126 | 1.15 | 0.99–1.34 | 0.054 | 1.08 | 1.00–1.17 | 0.051 |
| Serositis | 1.18 | 0.95–1.46 | 0.138 | 1.02 | 0.93–1.12 | 0.640 | 1.14 | 1.00–1.30 | 0.049* | 1.03 | 0.94–1.13 | 0.505 |
| Increase DNA binding | 1.39 | 0.89–2.19 | 0.150 | 0.99 | 0.91–1.08 | 0.797 | 1.23 | 0.96–1.59 | 0.108 | 0.99 | 0.91–1.08 | 0.882 |
| Fever | 0.05 | 0.00–7.34 | 0.240 | 0.84 | 0.63–1.13 | 0.245 | 1.18 | 0.96–1.45 | 0.128 | 0.81 | 0.60–1.08 | 0.151 |
| Thrombocytopenia | 1.05 | 0.76–1.46 | 0.771 | 1.09 | 0.94–1.27 | 0.242 | 1.12 | 0.95–1.32 | 0.165 | 1.07 | 0.93–1.23 | 0.355 |
| Leukopenia | 1.14 | 0.93–1.40 | 0.208 | 1.04 | 0.96–1.13 | 0.370 | 1.10 | 0.98–1.25 | 0.119 | 0.97 | 0.90–1.06 | 0.497 |
Comparison of the senescent T cell percentages and IFN-γ according to disease activity
Our next observation was to assess the differences of the senescent T cell percentages and IFN-γ levels according to the SLE disease activity. This comparison analysis is shown in Table V. Patients with active disease had significantly higher percentages of CD8+CD57+ (12.7 ±6.9% vs. 7.9 ±6.9%, p = 0.041) and CD8+KLRG1+ (15.2 ±7.4% vs. 8.4 ±5.3%, p = 0.004) T cells compared to the patients with inactive disease activity.
Table V
Comparison of immunosenescence markers according to disease activity status of systemic lupus erythematosus patients
| Variable | Inactive SLE patients (n = 12) | Active SLE patients (n = 41) | p-value |
|---|---|---|---|
| CD4+CD57+ [%] | 1.2 (0.7–2.4) | 0.8 (0.6–1.9) | 0.444 |
| CD4+KLRG1+ [%] | 2.1 (1.3–5.0) | 2.5 (1.2–4.6) | 0.772 |
| CD8+CD57+ [%] | 7.9 ±6.9 | 12.7 ±6.9 | 0.041* |
| CD8+KLRG1+ [%)] | 8.4 ±5.3 | 15.2 ±7.4 | 0.004* |
| IFN-γ levels [pg/ml] | 146.7 (130.2–210.8) | 208.9 (148.3–233.8) | 0.048* |
However, the percentages of CD4+CD57+ and CD4+KLRG1+ T cells were not statistically different between the 2 groups (p = 0.444 and p = 0.772, respectively). Interferon γ levels were statistically higher in the patients with active disease compared to the inactive ones (208.9 [148.3–233.8] pg/ml vs. 146.7 [130.2–210.8] pg/ml, p = 0.048).
Association between the senescent T cell percentages and IFN-γ with the systemic lupus erythematosus disease activity
The associations between the SLE disease activity with the immunosenescence markers are shown in Figure 2. The increase of SLEDAI score was associated with increased CD8+CD57+ T cell percentages (r = 0.367, p = 0.003 for the Pearson analysis and 0.079, 95% CI: 0.023–0.136, p = 0.007 for the linear regression analysis).
Fig. 2
Association between SLEDAI score and immunosenescence markers, including: CD4+ CD57+ T cell percentages (A), CD8+ CD57+ T cell percentages (B), CD4+ KLRG1+ T cell percentages (C), CD8+ KLRG1+ T cell percentages (D), IFN-γ levels (E).
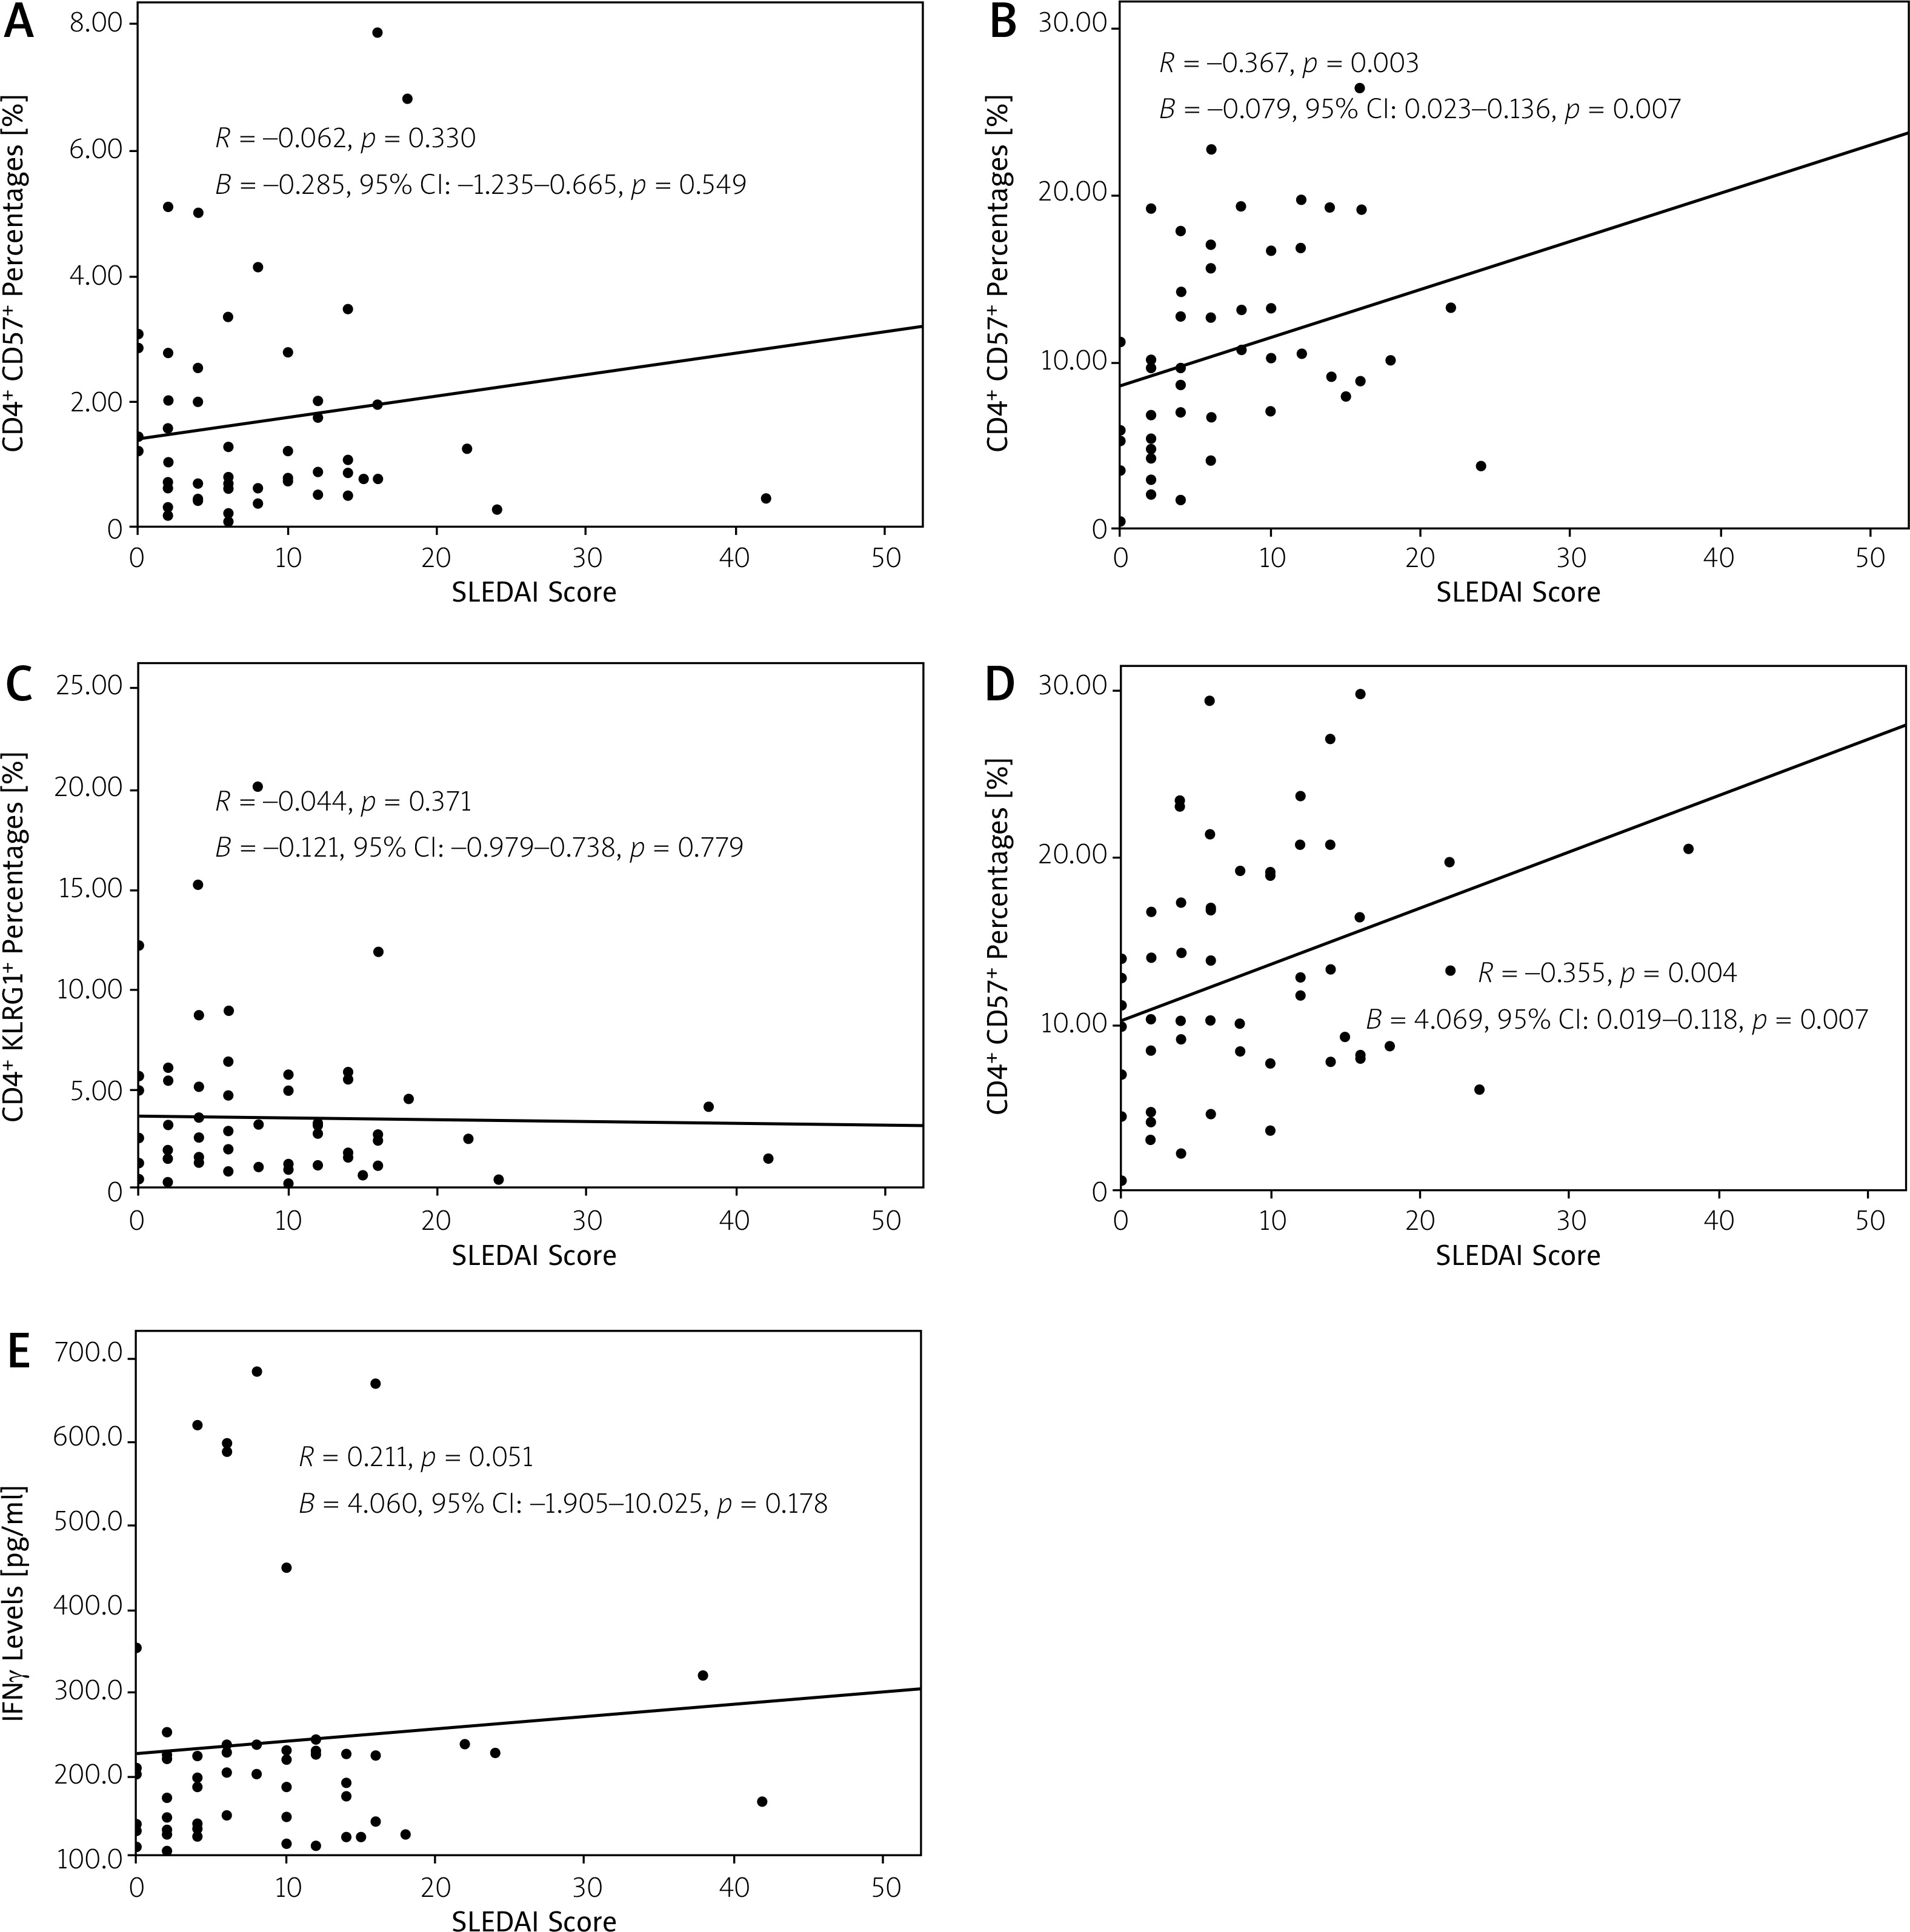
The SLEDAI score was also positively associated with the increased percentages of CD8+KLRG1+ T cells (r = 0.355, p = 0.004 for the Pearson analysis and 0.069, 95% CI: 0.019–0.118, p = 0.007 for the linear regression analysis). No association was found between the SLEDAI score with the percentages of CD4+CD57+ and CD4+KLRG1+ T cells, and IFN-γ levels.
Discussion
Aged CD4+ and CD8+ T cells would express the senescence markers. One of the most expressed markers in the terminally differentiated T cells was CD57 and KLRG1 [3]. This study showed that in SLE patients, CD57 and KLRG1 expression in CD8+ T cells was significantly higher in patients with active disease activity and positively associated with the SLE disease activity assessed by the SLEDAI score. The percentages of aged CD4+ and CD8+ T cells were also higher in SLE patients with some clinical manifestations, such as in the patients who had neuropsychiatric lupus, vasculitis, nephritis, or mucocutaneous manifestations.
Although there are still few studies regarding the role of CD57 and KLRG1 expression in SLE, CD57-expressing T cells could develop several pro-inflammatory conditions that might contribute to the more severe disease activity and clinical manifestations in the patients with autoimmune diseases, including SLE.
The CD57 antigen was known to play an essential role in cell-to-cell and cell-to-matrix interaction. CD57+ T cells also developed several signs of cellular senescence, such as proliferation defect, changes in the mitochondrial function, increased reactive oxygen species (ROS), mitogen-activated protein kinase (MPAK), and DNA damage marker γH2AX [7].
Moreover, senescent CD8+ T cells that expressed the CD57 molecules could also secrete several cytokines, such as tumour necrosis factor-α (TNF-α) and IFN-γ when exposed to antigens had a high cytotoxic potential with increased expression of granzymes, granulising, and perforin [10].
Similarly to this study, several autoimmune diseases were observed with the increase of highly cytotoxic CD8+CD57+ T cells in the peripheral blood, such as Graves’ disease [12], ankylosing spondylitis, and rheumatoid arthritis [13]. It was also shown that CD8+CD57+ T cells were accumulated in the diseased tissue in patients with dermatomyositis and polymyositis [14]. These cells actively played a role in the autoimmune response and were thought to be associated with more severe clinical manifestation [15].
On the other hand, T cells that express KLRG1 also promote pro-inflammatory conditions due to the ability to secrete the inflammatory cytokines, such as IFN-γ. It was shown that KLRG1-expressed T cells had 2.5 to 6.25 folds higher to produce the cytokines compared to the normal unstimulated cells [16]. The increase of KLRG1+ T cells was already observed in the synovial fluid in the patients with RA and spondyloarthropathies [17].
Thompson et al. [18] showed that CD8+CD28-KLRG1+ T cells in the patients with RA indicated inadequate treatment responses to DMARDs in early arthritis.
Compared to the senescent CD8+ T cells, both CD4+CD57+ and CD4+KLRG1+ T cells were not associated with our subjects’ disease activity. This finding raised a possible explanation that CD8+ T cells might be more susceptible to aging than CD4+ T cells. Quantitatively, the memory T cells in CD8+ T cell compartments were more numerous than those in CD4+ T cell compartments. In addition, the CD57 expression in CD4+ T cells was less than in CD8+ T cells in a similar age range [19].
Due to the differences in the susceptibility to aging, the ability of CD4+CD57+ T cells to induce inflammation was thought not to be as strong as in CD8+CD57+ T cells. Wang et al. [20] observed that the aged CD4+ T cells did not significantly affect the pro-inflammatory cytokine secretion compared to CD8+ T cells. Another study also showed that IFN-γ levels produced by CD4+CD57+ T cells were markedly lower than CD8+CD57+ T cells [21].
Neuropsychiatric manifestations were observed to have higher percentages of senescent T cells in our study. We found that CD4+CD57+, CD4+KLRG1+, and CD8+KLRG1+ T cell percentages were significantly higher in the subjects with neuropsychiatric manifestations. Psychiatric abnormality was relatively common in SLE, with a prevalence of 17–75%. Functional effector T cells could infiltrate the brain, usually in the choroid plexus area where the vascularization was very high [22].
Terminally differentiated T cells would be more pro-inflammatory that produced several cytokines that could activate the innate immunity (macrophages and neutrophils) and also cytotoxic T cells, which were the dominant component involved in neurodegenerative diseases and neuroinflammation through the pro-inflammatory cytokines pathway and direct cytotoxicity effect to the neurons [23].
The association between disease activity in SLE with the aged CD8+ T cells was previously thought to be affected by the presence of the pro-inflammatory cytokines, such as IFN-γ. CD8+CD57+ and CD8+KLRG1+ were previously shown as the potent producers of the IFN-γ [24]. Interferon γ could promote the pro-inflammatory conditions through several mechanisms, including increasing the toll-like receptor (TLR) signalling by increasing the TLR expression, improving downstream signalling components, sensitizing NF-kB to activation, and preventing inhibition mechanisms, such as IL-10 production [25].
Moreover, increased IFN-γ expression could lead to the development of systemic autoimmunity, as documented in a study, that epidermal transgenic IFN-γ expression would result in a production of anti-dsDNA and anti-histone autoantibodies and glomerulonephritis [26].
However, although we did show the higher levels of IFN-γ in the SLE patients with active disease, the IFN-γ levels did not have any association with the SLEDAI score.
Therefore, the role of senescent CD8+ T cells in affecting the disease activity in SLE might be due to other mechanisms. Other pro-inflammatory cytokines produced by the terminally differentiated T cells, such as TNFα, IL-6, or IFN type 1, could be further evaluated to explain the better mechanisms of the contribution of senescent CD8+ T cells to SLE disease activity.
Conclusions
Our study concludes that there is a low positive correlation between the T cell senescence, especially the CD8 compartment, with the disease activity in SLE patients. This study showed that these senescence T cells play minor roles in SLE disease activity.
Further studies are needed to explore the role of immunosenescence in the autoimmune diseases and the possible use of senescence marker as an indicator of autoimmune disease activity.