
Introduction
Total knee arthroplasty (TKA) is widely accepted as the best treatment option for end-stage osteoarthritis (OA). It ranks among the most frequently performed surgeries in current orthopaedic practice [1]. The Agency for Healthcare Research and Quality projects that the annual number of TKA procedures will reach 3.5 million by 2030 [2]. The worldwide recognition of this procedure as a highly successful intervention, supported by reliable techniques and instrumentation, is attributed to its global prevalence and high patient satisfaction rate [3].
Besides surgical volume and the surgeon’s experience, the proper component sizing appears to be a highly important factor influencing the outcome of the surgery. It provides proper implant fitting, minimizes the risk of loosening, and aids in restoring the native joint line with preservation of knee biomechanics, reducing malalignment [4]. Therefore, component sizing is crucial for optimizing patient-reported outcomes [5]. The profile of patients who undergo TKA has changed in recent years. Many of them report severe, persistent pain with limitation of daily activities and joint stiffness [6]. Moreover, the obesity epidemic has resulted in an increased number of patients with high body mass, which is usually associated with a large adipose tissue volume. This tissue is characterized by an increased amount of pro-inflammatory cytokines, which might negatively affect cartilage quality and exacerbate degenerative changes [7]. These cytokines, synthesized in higher quantities due to excess adipose tissue, promote joint inflammation and cartilage deterioration, consequently worsening the clinical course of OA [8]. Increased body mass leads to higher mechanical loads on the joints, which accelerate articular cartilage wear and OA progression [9]. It may also contribute to the wear of the implanted prosthesis [10]. Additionally, obesity is frequently associated with cardiovascular diseases such as hypertension or coronary artery disease and metabolic disorders including type 2 diabetes mellitus [11]. These comorbidities can increase the risk of perioperative complications such as deep vein thrombosis, infection, delayed wound healing, and prosthesis-related failure [12].
Some reports indicate that preoperative body mass is a significant determinant of TKA outcomes, as overweight and obese patients may report lower levels of satisfaction with the procedure [13]. Despite the general success of TKA, approximately 25–30% of patients report dissatisfaction after the procedure [14]. These are mostly obese patients who present with concerns about persistent pain, limited function, or unmet expectations [15]. Indeed, psychological distress related to obesity and functional impairment may be the factors affecting patients’ personal evaluation of TKA outcomes and their overall quality of life [16]. This highlights the complexity of the outcome profile in this population group. Interestingly, some patients attribute their weight and, consequently, their body size not to lifestyle factors or adipose tissue volume, but rather to increased bone thickness. We questioned whether this commonly cited explanation of increased bone thickness represents a true structural factor or merely serves to rationalize and justify a patient’s inability to change their lifestyle. The aim of this study was to evaluate whether tibial and femoral diameters differ between normal-weight and overweight patients, to determine whether these dimensions and patients’ body mass index (BMI) may serve as reliable preoperative predictors of component sizes, and to assess whether preoperative body mass, as determined by BMI, influences patients’ reported outcomes following TKA.
Material and methods
We retrospectively analysed data from a group of patients who underwent primary TKA using the Journey II BCS prosthesis without patellar resurfacing between 9th January and 30th November 2023.
A total of 108 patients (43 males and 65 females) were included in this study. There were 62 left knees and 46 right knees operated with TKA due to OA. The average age of patients included in the study was approximately 67 ±4.1 years, whereas their BMI was approximately 29 ±3.9 kg/m².
All patients were operated on at our institution, a level III academic hospital. Inclusion criteria were age over 55 years, qualification for TKA as a treatment for primary or secondary knee OA (Kellgren-Lawrence grade III or IV) and fluency in the Polish language.
Exclusion criteria were incomplete radiographs available for review, qualification for cruciate-retaining implants (no flexion contracture prior to the surgery and intact posterior cruciate ligament at the time of the procedure), prior lower limb surgery, mental illness and neurological impairment.
Patients were divided into 2 groups: normal weight (BMI < 25) and excessive weight (BMI ≥ 25). This grouping, which followed the World Health Organization (WHO) classification, was used for subsequent comparisons in radiographic and clinical outcome analyses [17]. Overweight and obese patients were pooled into a single group (BMI ≥ 25) for comparative analysis.
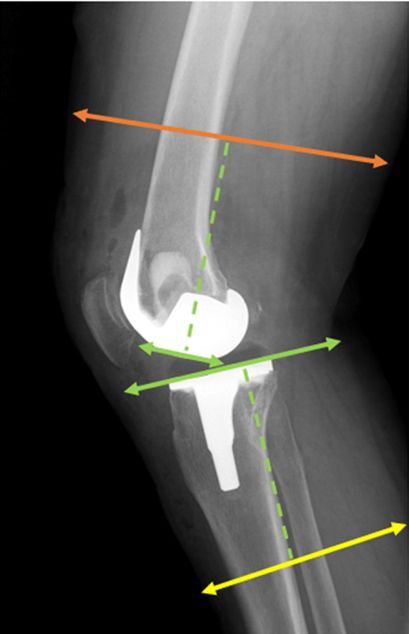
All surgical procedures were performed by the same experienced surgeon using a standard midline incision and medial parapatellar arthrotomy. In every case, a tourniquet was used for implant cementation, for an average of 18 minutes, and postoperative drainage was maintained for at least 12 hours. The postoperative protocol included chemical and mechanical thromboprophylaxis, unless specifically contraindicated. All patients were subjected to a weight-bearing and long-leg view X-ray examination in the standing position with antero-posterior and lateral projection performed prior to and following the surgery. All measurements were obtained from postoperative radiographs. The bone and limb widths were measured 10 cm above the intercondylar line and 10 cm below the tibial plateau parallel to the prosthesis weight-bearing surface (Figs. 1, 2). For further calculations, we took the mean value of our measurements from the lateral and antero-posterior side. Our measurements were conducted by 2 independent researchers, and the mean values of their results were recorded. The data obtained were then compared to a particular component size. Analysis of the radiographic images was performed using the INFINITT PACS system (INFINITT Healthcare, Seoul, South Korea). Besides radiographic analysis, we also performed clinical evaluation of our patients at admission and at the follow-up appointment approximately 1 year after the surgery. They were asked to fill out the KOOS and WOMAC questionnaires. All patients completed the questionnaires independently. The surveys were collected and assessed thereafter. Body mass index was calculated using the standard formula. To avoid potential bias, all data concerning participants were kept blinded. Informed consent was obtained from all subjects involved in the study.
Fig. 1
Antero-posterior view of the lower limb measurement areas. The green dashed line marks a distance of 10 cm from the intercondylar line and the tibial plateau, marking the femoral and lower leg measurement regions indicated by the orange and yellow lines, respectively.
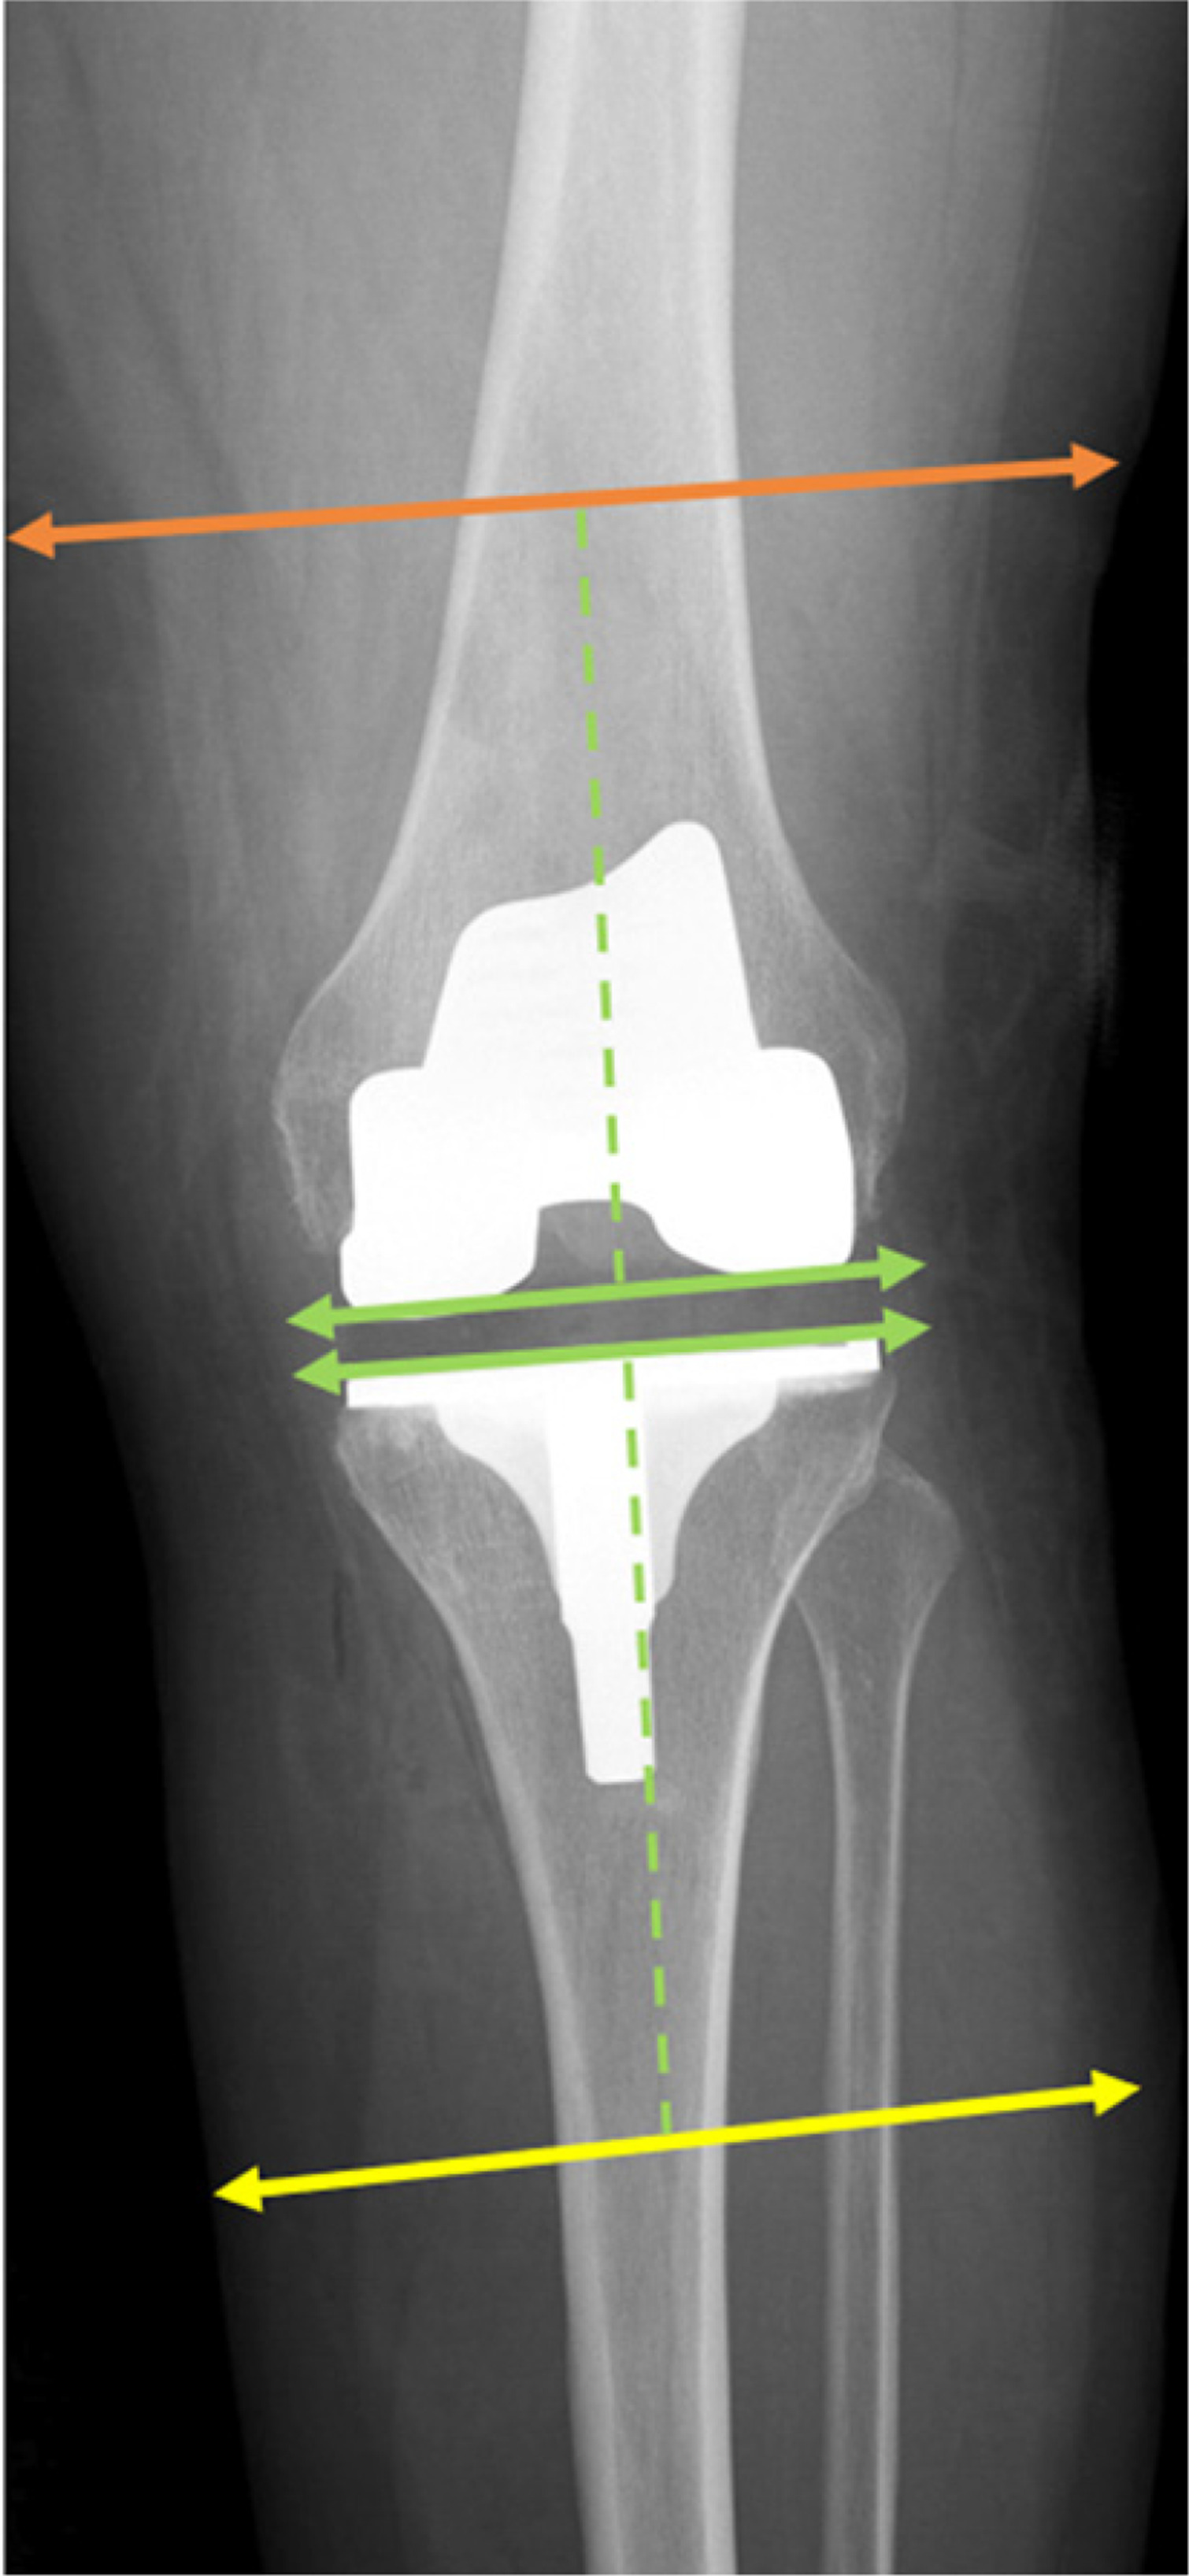
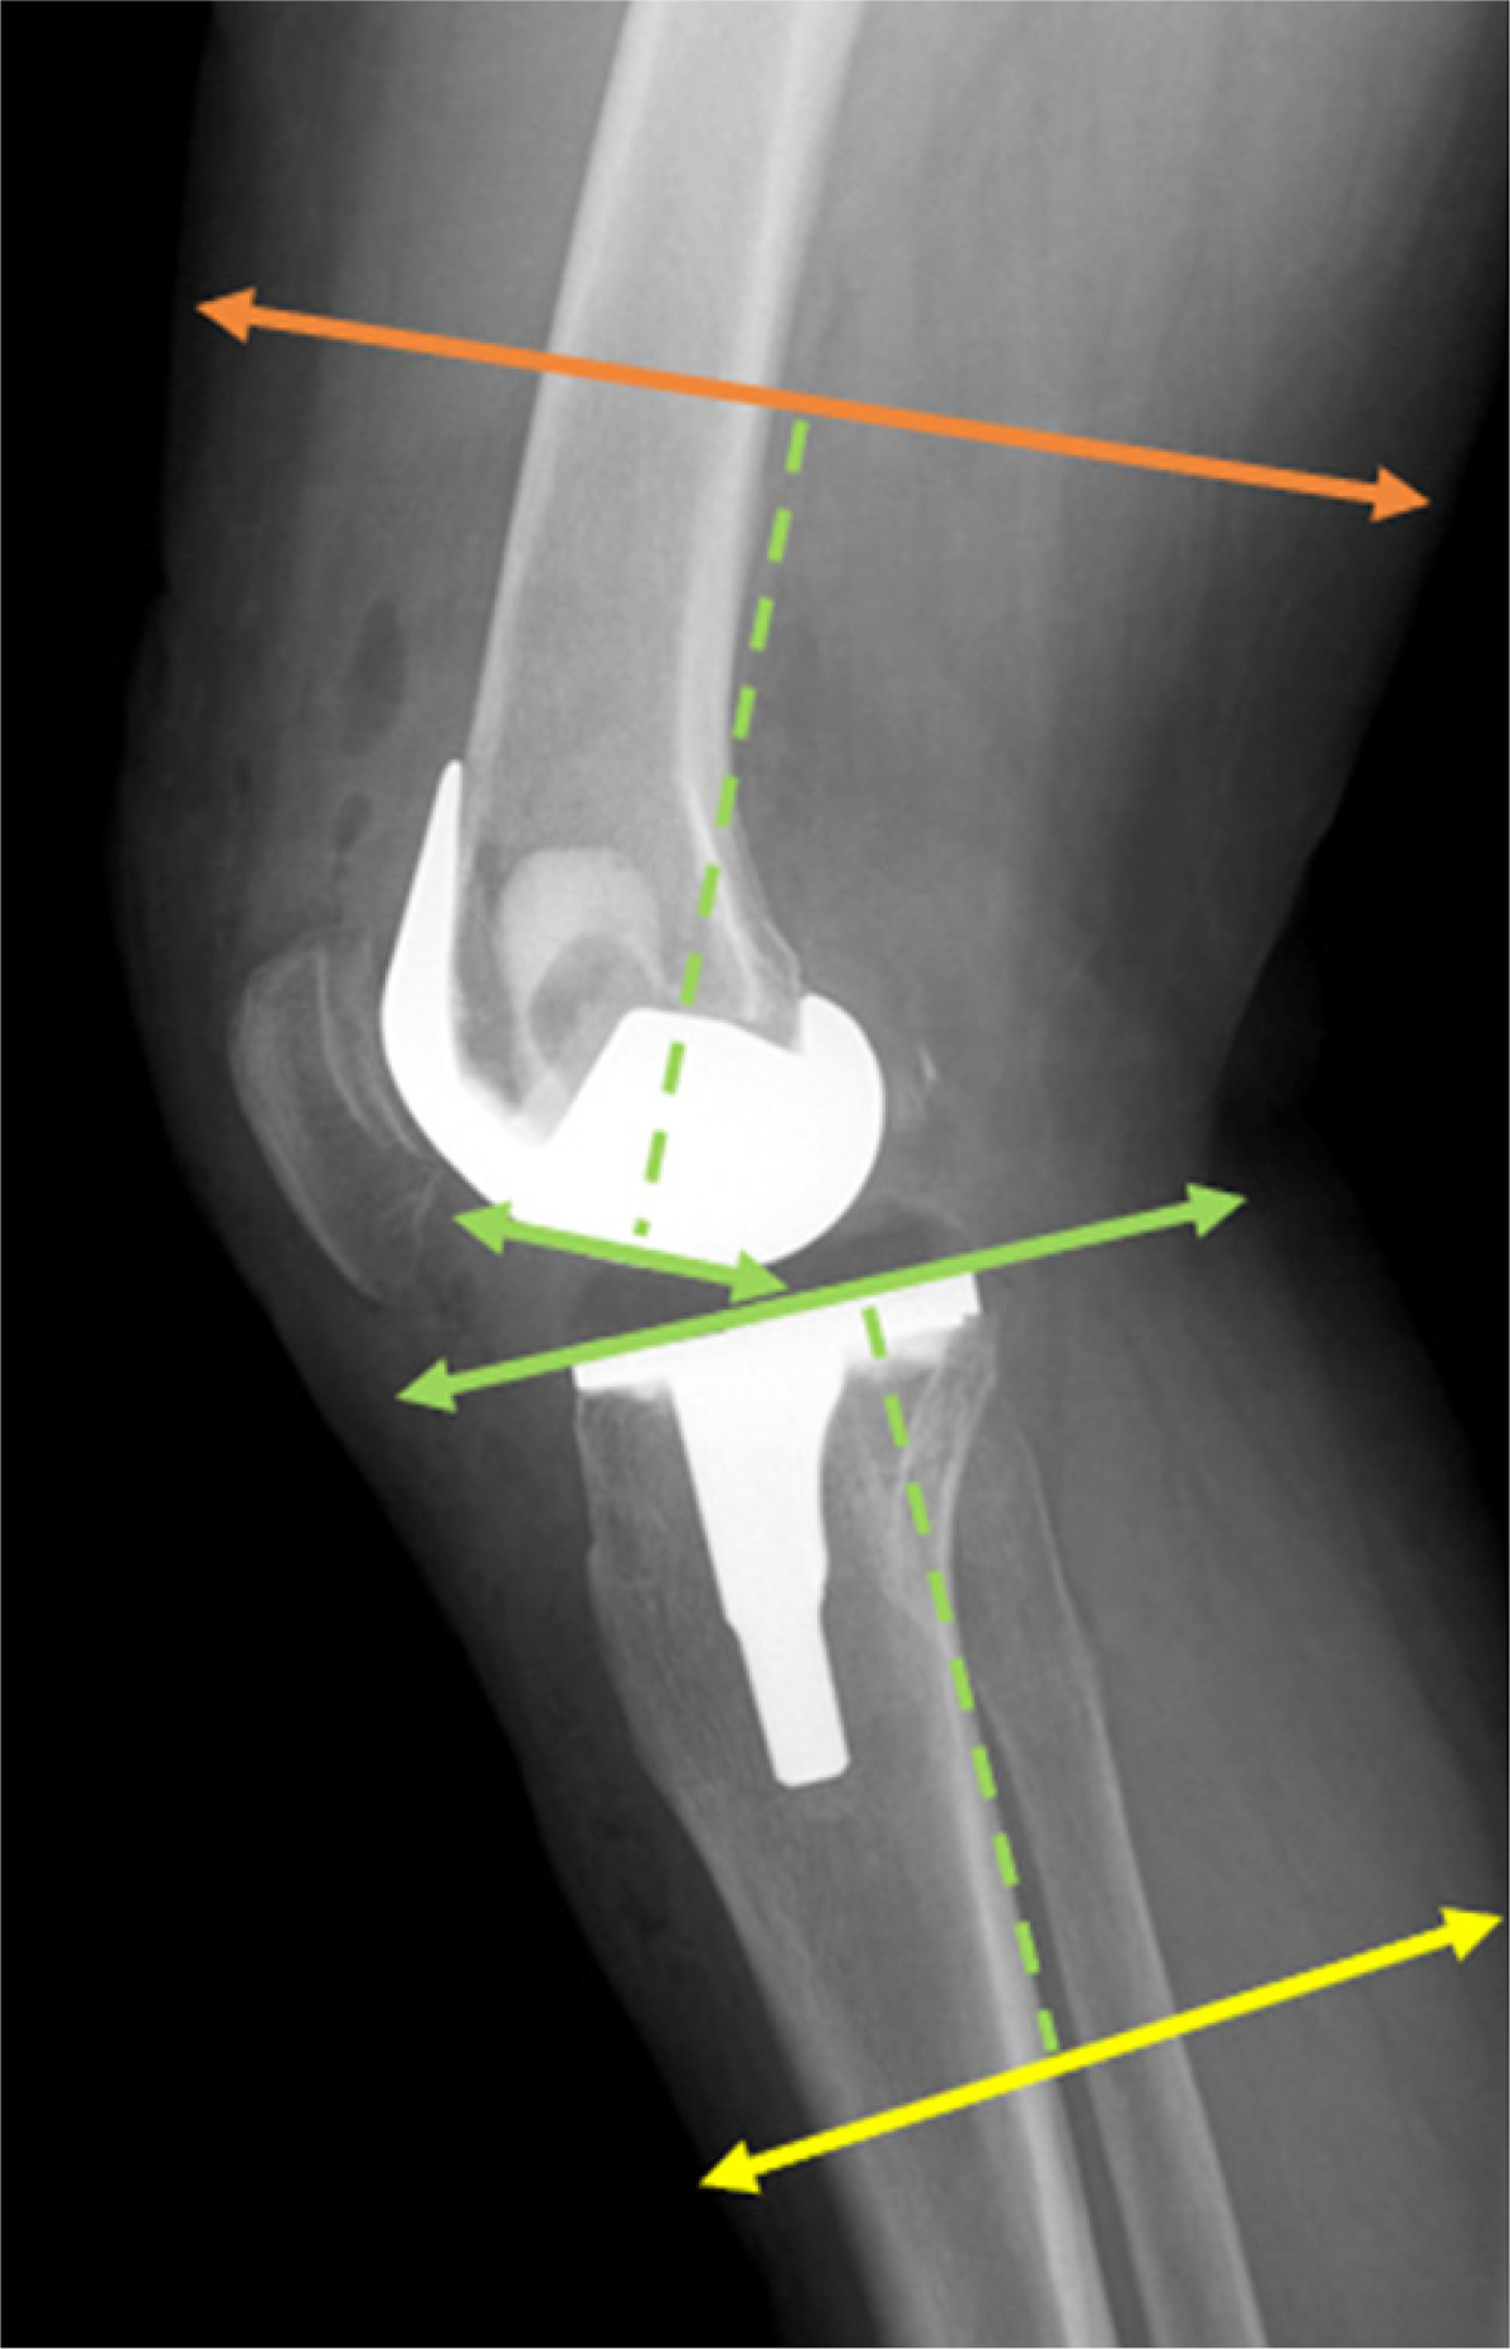
Fig. 2
Lateral view of lower limb measurement areas. The green dashed line marks a distance of 10 cm from the intercondylar line and the tibial plateau, marking the femoral and lower leg measurement regions indicated by the orange and yellow lines, respectively.
Statistical analysis
Statistical analysis of the results was performed. All the comparisons were conducted between continuous variables in independent groups. Therefore, either Student’s t-test or the Mann-Whitney U test was used to assess differences between the BMI < 25 group and the BMI ≥ 25 group, according to the normality of distribution examined with the Shapiro-Wilk test. For analysis of extremity diameters in relation to implant size, the Kruskal-Wallis test was used. The significance level was set at α = 0.05. The study sample was selected retrospectively based on inclusion criteria and consisted of 108 patients. To determine the adequacy of this sample size, a post hoc power analysis was performed. With a moderate effect size (Cohen’s d = 0.55) and the same α = 0.05, the achieved power was approximately 80%. The effect size was estimated on the basis of observed differences in femoral and tibial diameters between BMI groups and represents a clinically meaningful magnitude. Accordingly, the analysis indicated that the sample size was sufficient to detect statistically significant differences between groups with acceptable power. All statistical analyses were conducted using SAS software, Version 9.4 for Windows (SAS Institute Inc., NC, USA)
Results
In total, 108 patients (43 males and 65 females) were included in the study. Among them, 62 had OA of the left knee and 46 had OA of the right knee. The mean age of patients included in the study was 67.4 ±4.1 years, and their BMI was 29.3 ±3.9.
There was a statistically significant difference in terms of femoral and lower leg diameters between the BMI groups (Table I). The mean femoral diameter was 17.3 ±1.9 cm in the BMI ≥ 25 group compared to 15.8 ±2.1 cm in the BMI < 25 group (p = 0.02). Similarly, lower leg diameter was greater (14.0 ±1.5 cm) in the BMI ≥ 25 group than in the BMI < 25 group (12.5 ±1.2 cm), also reaching statistical significance (p = 0.002).
Table I
Comparison of leg dimensions among 2 different BMI groups
| BMI < 25 (n = 41) | BMI ≥ 25 (n = 67) | p | |
|---|---|---|---|
| Femoral diameter (cm) | 15.8 ±2.1 | 17.3 ±1.9 | 0.0231 |
| Tibial diameter (cm) | 12.5 ±1.2 | 14.0 ±1.5 | 0.0024 |
Satisfaction measured by PROM questionnaires (WOMAC and KOOS) was similar between the BMI groups. Normal-weight patients demonstrated slightly better outcomes, but the difference was not statistically significant (p = 0.74 and p = 0.49, respectively; Table II).
Table II
ΔWOMAC and ΔKOOS in relation to the patient’s BMI level
| BMI < 25 (n = 41) | BMI ≥ 25 (n = 67) | p | |
|---|---|---|---|
| ΔWOMAC | –45.3 | –43.5 | 0.7369 |
| ΔKOOS | –52.9 | –60.7 | 0.4916 |
Both femoral (p = 0.94) and tibial (p = 0.48) component sizes in TKA were related neither to patient’s BMI nor to bone dimensions in femoral and tibial area (Tables III and IV).
Discussion
In the era of the ongoing obesity epidemic, orthopaedic surgeons must adapt their approaches to suit the needs of overweight and obese patients [18], as high body mass leads to overstrain of the musculoskeletal system, especially the knee joint [19]. Thus, obese patients constitute a large proportion of orthopaedic patients, often requiring surgical treatment with endoprosthesis [20]. So far, many authors have pointed out that obesity is associated with poorer results of knee arthroplasty, leading to ongoing efforts to improve those outcomes [21]. Increased body mass may also increase the stresses on knee implants by magnifying the forces applied to these components [22]. These forces have to be evenly distributed for the implant to remain stable and durable. Without precise biomechanical alignment, increased loads can accelerate wear of the implant, potentially leading to early loosening or failure [23].
Many studies have compared postoperative satisfaction following TKA between obese and non-obese patients on the basis of various questionnaires. Papakostidou et al. [24] found no significant difference in satisfaction rate between these groups at 6 and 48 weeks following TKA. In their study consisting of 204 patients, more than 100 were classified as obese with BMI over 30. They reported an even greater post-operative improvement in WOMAC pain, function and total score among obese patients compared to the normal weight group [24]. Similar findings at 12 months were reported by Singh et al. [25]. In this study, 1,075 patients who completed questionnaires related to postoperative satisfaction regarding the FJS-12 score were analysed. The distribution of the sample based on BMI categories included non-obese patients and 3 groups of obese patients, depending on obesity class. All groups demonstrated postoperative improvement, although patients with higher BMI reported lower mean FJS-12 scores. However, these differences were not found to be significant. Moreover, all obese patients experienced comparable functional improvement after the TKA procedure [25].
Similar overall findings were obtained in our study, although we had a smaller group of patients. After 12 months, the results of the WOMAC and KOOS questionnaires demonstrated that the normal-weight group had slightly better outcomes in comparison to their overweight or obese counterparts. However, such differences were not statistically significant. These data provide evidence of comparable short- and long-term patient reported outcomes, regardless of BMI and the questionnaire used during follow-up evaluation.
Improper implant fitting is responsible for nearly 50% of dissatisfaction after TKA [26, 27]. To obtain the best possible results following the surgery, it is crucial to provide at least a proper femoral and tibial component rotation and their sizing. In order to reduce blood loss, wound exposure and length of anaesthesia, affecting the procedure complication rate, it should be performed precisely and efficiently. Therefore, preoperative planning is critical to reduce the duration of the surgery. In our study, we assessed whether BMI is a reliable predictor of prosthesis size.
Marino et al. [28] underlined that accurate sizing of prosthetic components is crucial for the success of TKA. Whereas in their study they were able to use height, weight, and sex as predictors of implant size within ±1 size with high accuracy, our findings revealed no statistically significant correlation between BMI, limb dimensions, and component size. However, this might be related to the biomechanical and anatomical peculiarities of our cohort, where larger BMI did not influence the bone diameters and failed to translate into size of the chosen implant. This may highlight the potential limitation of using demographic data for purposes such as templating in a diverse population. These findings indicate that, for general applicability and reliability, predictive models such as the arthroplasty size predictor need to be validated across a wide range of clinical settings [28].
An in-depth analysis of the relationship between patient demographics and implant size will help in further optimizing the outcomes of TKA. The study by Gao et al. [29] showed that, based on the literature, implant size is strongly correlated with weight and height but is less dependent on BMI. This partially aligns with our findings, where higher BMI was associated with increased femoral and tibial diameters, but did not influence the size of the implant selected. This discrepancy suggests that not only demographic data, but also anatomical considerations and surgeon preference are important in predicting implant sizes. Furthermore, the lack of any relationship with BMI in both series shows that BMI alone cannot be used for accurate templating. These observations demonstrate how difficult it is to balance the patient-specific variables in designing and choosing prosthetics [29].
Ostovar et al. [30] found that incorporating demographic data with ankle volume significantly improved the prediction of TKA component sizes. While sex, height and ankle volume were found to be strong predictors of tibial and femoral component sizes, BMI did not demonstrate a similar correlation. This further supports the findings of our present study, which demonstrated that BMI influenced limb dimensions but did not correlate with implant size. The inclusion of ankle volume as a predictor introduces new possibilities and enhances the precision of preoperative templating. These studies suggest that detailed anatomic measurements, beyond the standard demographic data, may be important to incorporate for improving the accuracy of implant selection and preoperative planning in TKA [30].
Consequently, in our study, attempts to correlate the dimensions of the limb with implant size were unsuccessful. Specifically, the limb’s transverse and sagittal diameters were more closely related to the volume of the adipose tissue than to bone thickness. Our analysis found no reliable correlation, which would support the clinical application of this approach as a useful tool for preoperative planning.
Study limitations
This study has some limitations. First of all, it was conducted as a retrospective analysis at a single centre, which may limit the reliability of the results. In addition, although the sample size was adequate for the primary analysis, it may not have been sufficient to capture subtle differences in the functional outcomes. Body mass index was used as a surrogate measure for obesity, however, it does not reflect variations in muscle mass or fat distribution. Moreover, overweight and obese patients were combined into a single group (BMI ≥ 25) for comparative analysis. Although consistent with the WHO classification, such consolidation might mask significant differences in clinical and radiological outcomes between subgroups. Finally, implant sizing was determined intraoperatively based on the same surgeon’s judgment. While this approach ensures technical consistency and minimizes variation due to surgical technique, it may potentially introduce bias related to individual decision-making.
Conclusions
Our study results indicate that while BMI is correlated with lower limb diameters in patients undergoing TKA, it does not significantly predict prosthesis component sizes. Similar clinical outcomes measured using the WOMAC and KOOS questionnaires were found in both normal-weight patients and overweight or obese ones. Although patients with normal BMI showed a slightly better functional outcome, the differences were not statistically significant. The evidence indicates that overweight patients should not be disqualified from TKA solely due to their body mass. Although they are at slightly higher risk of postoperative complications, they should be given an opportunity to maintain a pain-free lifestyle. Postoperatively, asymptomatic joints may encourage patients to increase physical activity, which can lead to body mass reduction. Additionally, orthopaedic surgeons should prioritize anatomical and clinical data over demographic data during preoperative planning. Further studies with larger, less heterogeneous cohorts and longer follow-up are needed to clarify the true influence of BMI on long-term prosthetic performance and patient satisfaction.