
Introduction
One of the autoimmune diseases with multi-systemic involvement is systemic lupus erythematosus (SLE), which is manifested by diverse clinical symptoms and serological manifestations [1]. Disease activity is usually assessed by a disease activity index known as SLEDAI that involves 24 clinical and laboratory variables [2].
Although some of these laboratory parameters are simple and easily obtained from complete blood count (CBC), e.g. leukocyte and platelet counts, others such as serum complement protein and antibody against anti-double stranded deoxyribonucleic acid (anti-dsDNA) levels may not easily obtained during routine daily practice.
Recently there is an emerging role of platelet parameters such as mean platelet volume (MPV), platelet distribution width (PDW) and their proportions to lymphocyte count in the assessment and prediction of prognosis in cardiovascular events, malignancies, metabolic conditions and infections [3–6].
The mean platelet volume, a measure of platelet size, is used to assess platelet function and activation and has been used as an inflammatory biomarker in rheumatoid arthritis (RA), active inflammatory enteropathic disease, and ankylosing spondylitis (AS) [7–10]. The platelet distribution width, which is a reflection of the heterogeneity in platelet size, is shown to be a simple biomarker in immunological diseases [10].
The mean platelet volume to lymphocyte ratio (MPVLR) is manually calculated by dividing the MPV by lymphocyte count, with a recent clinical significance in a variety of disorders including myocardial muscle damage by a thrombus, systemic inflammation, impairment of coronary collateral circulation, childhood appendicitis and diabetic nephropathy [11–14].
The platelet distribution width to lymphocyte ratio (PDWLR), which is easily calculated by dividing the PDW by lymphocyte count, has emerged as a predictor of cardiovascular risk and severity of snakes bites [15, 16]. In the literature, several studies have assessed the MPV and PDW in relation to SLE disease activity [7, 17–22].
To our knowledge, there has never been a study that compares MPVLR and PDWLR levels with lupus activity. The purpose of this study was to assess MPVLR and PDWLR in adult patients diagnosed with SLE, and compare them to healthy people. Furthermore, we investigated the relationship between these ratios and the Systemic Lupus Erythematosus Disease Activity Index (SLEDAI), as well as a probable correlation with anti-dsDNA, complement constituents C3 and C4, and platelet characteristics.
Material and methods
Study design
A case-control study was carried out on patients with SLE at the Rheumatology Clinic of Baghdad Teaching Hospital – Medical City Complex from April 2021 to January 2022.
Participants
Sixty-two Iraqi patients with SLE disease fulfilling the criteria for SLE established by the American College of Rheumatology (ACR) [23] were consecutively selected.
Seventy-nine healthy staff volunteers served as a control group matched in age and gender. Subjects with infections, malignancy or other connective tissue diseases such as dermatomyositis, systemic sclerosis, or rheumatoid arthritis were excluded from the study.
Data obtained using questionnaire forms included: age, gender, current smoking status, weight in kilograms, height in meters. Body mass index (BMI) was calculated according to the following formula [24]: BMI = weight in kilograms/height in meters squared. Disease duration in years, current medications involving steroid, its dose, nonsteroidal anti-inflammatory drugs (NSAIDs), and immunosuppressants such as disease-modifying anti-rheumatic drugs (DMARDs) or rituximab were recorded.
Systems involved such as mucocutaneous, musculoskeletal, renal, pleuropulmonary, cardiac, neuropsychiatry gastrointestinal, ocular, hematological, constitutional and result of renal biopsy if available, together with disease activity using SLEDAI (SELENA modification) were all recorded.
White blood cell count, lymphocyte, neutrophil, platelet counts, PDW, MPV, erythrocyte sedimentation rate (ESR), immunological markers such as anti-nuclear antibody (ANA), anti-dsDNA, and complements (C3, C4) were recorded.
The mean platelet volume to lymphocyte ratio and PDWLR were calculated manually by dividing MPV and PDW obtained from CBC done by an ADVIA analyzer (SIEMENS) by lymphocyte count respectively. Twenty-four hours urine protein assessment was performed in patients with renal involvement.
Statistical analysis
For non-normally distributed continuous variables, the data were reported as the median (interquartile range), and for categorical variables, the number (percentages). The Mann-Whitney U test was employed to discriminate differences between continuous variables, while the χ2 test was utilized for categorical variables.
Validity assessment for PDWLR and MPVLR to differentiate SLE patients from healthy controls was measured using receiver operating characteristics (ROC) curve analysis. It is considered a perfect test if the area under the curve (AUC) is 1.0, an excellent test if AUC is 0.9–0.99, a good test if AUC is 0.8–0.89, a fair test for 0.7–0.79 and a poor test for AUC 0.51–0.69, and lastly AUC of 0.5 is of no significance.
Correlation between patients’ socio-demographics and clinical features was calculated using Spearman’s correlation. A statistically significant p-value was less than 0.05. SPSS 26 was used to perform all of the statistics (IBM Corp, USA, 2019).
Bioethical standards
The study protocol was approved by the University of Baghdad, College of Medicine, Rheumatology and Medical Rehabilitation Unit in accordance with the Declaration of Helsinki.
Each participant in the study was required to sign an informed consent form. Before becoming involved in the study, all participants who agreed to be involved in the study were given a cover letter describing the study objectives as well as a written informed consent form.
Results
Baseline features of systemic lupus erythematosus patients and controls
The research included 141 people in all, including 62 SLE patients and 79 healthy controls. Demographic and clinical variables are shown in Table I.
Table I
Baseline characteristics of systemic lupus erythematosus patients and controls
| Variables | SLE patients (n = 62) | Controls (n = 79) | p-value |
|---|---|---|---|
| Age [years, median (IQR)] | 30.50 (23.00, 40.00) | 31.00 (26.00, 40.00) | 0.443 |
| Gender [n (%)] | |||
| Female | 56 (90.3) | 62 (78.5) | 0.069 |
| Male | 6 (9.7) | 17 (21.5) | – |
| BMI [median (IQR)] | 27.35 (24.92, 30.92) | 25.80 (22.40, 29.30) | 0.12 |
| Disease duration [years, median (IQR)] | 3.00 (1.00, 6.00) | Not applicable | |
| SLEDAI [median (IQR)] | 9.00 (5.25, 16.00) | Not applicable | |
| DMARDs [n ( % )] | |||
| None | 7 (11.30) | Not applicable | |
| HCQ | 2 (3.23) | Not applicable | |
| Combined* | 53 (85.47) | Not applicable | |
| NSAIDs**users [n (%)] | 7 (11.3) | Not applicable | |
| Prednisolone users [n (%)] | 50 (80.6) | Not applicable | |
| Rituximab users [n (%)] | 6 (9.7) | Not applicable | |
BMI – body mass index, DMARDs – disease-modifying anti-rheumatic drugs, HCQ – hydroxychloroquine, IQR – interquartile range, NSAIDs – nonsteroidal anti-inflammatory drugs, p-value – probability value (< 0.05), SLE – systemic lupus erythematosus, SLEDAI – Systemic Lupus Erythematosus Disease Activity Index.
Difference between lupus patients and healthy controls in mean platelet volume to lymphocyte ratio and platelet distribution width to lymphocyte ratio
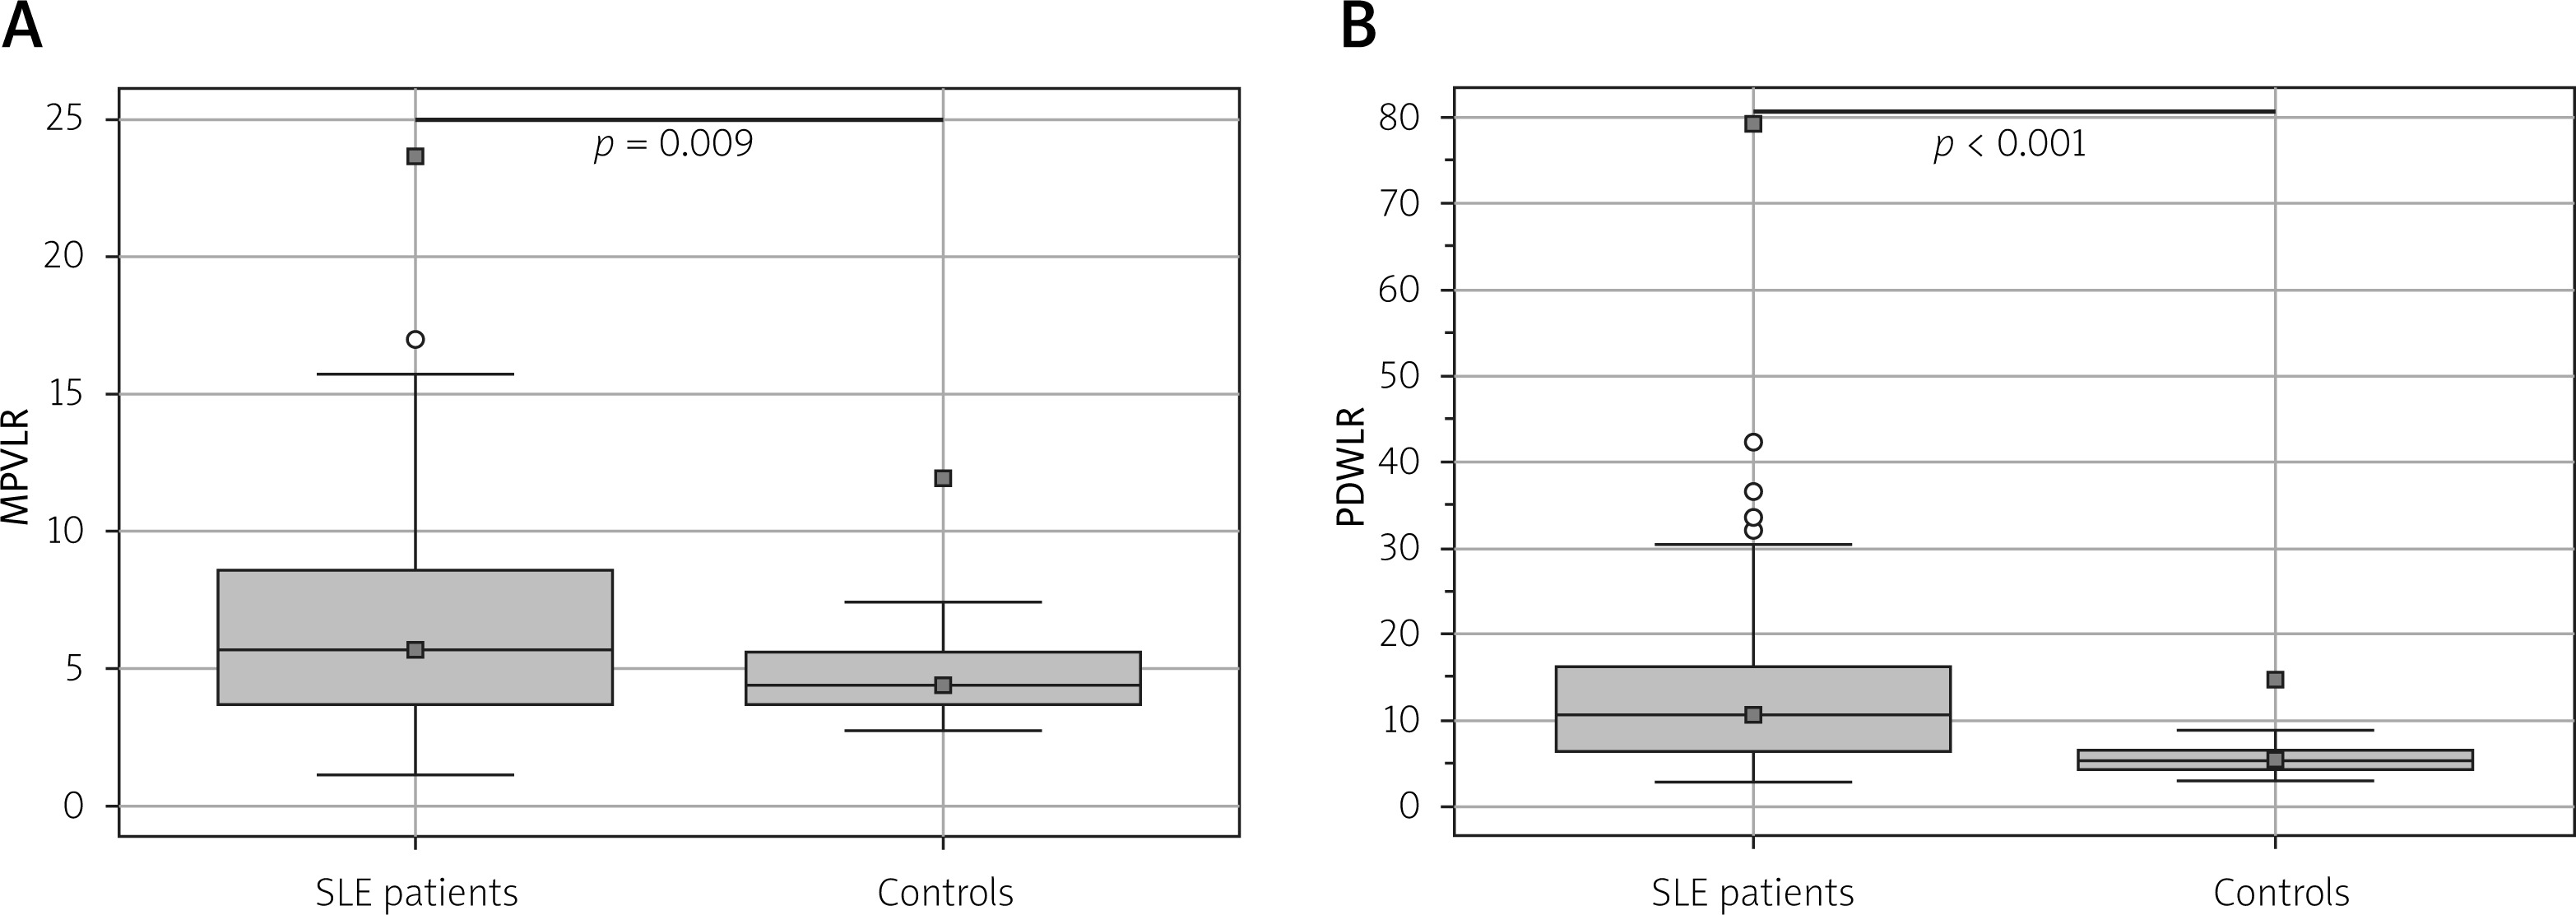
The median (IQR) for MPVLR in SLE patients was significantly higher than the value of the controls (5.69 [1.16–23.67] vs. 4.40 [2.78–11.93], p = 0.009) respectively. Also, the median (IQR) for PDWLR was significantly higher in patients with SLE compared with the controls (10.51 [2.87–79.37] vs. 5.21 [2.88–14.66], p < 0.001) as shown in Figure 1.
Validity of mean platelet volume to lymphocyte ratio and platelet distribution width to lymphocyte ratio in patients with systemic lupus erythematosus and controls
To evaluate the use of MPVLR and PDWLR as assays for distinguishing SLE patients from healthy controls, the receiver operating characteristic curve (ROC) was performed (Fig. 2).
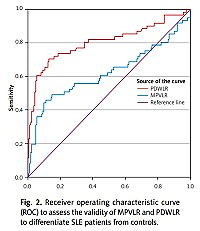
Fig. 2
Receiver operating characteristic curve (ROC) to assess the validity of MPVLR and PDWLR to differentiate SLE patients from controls.
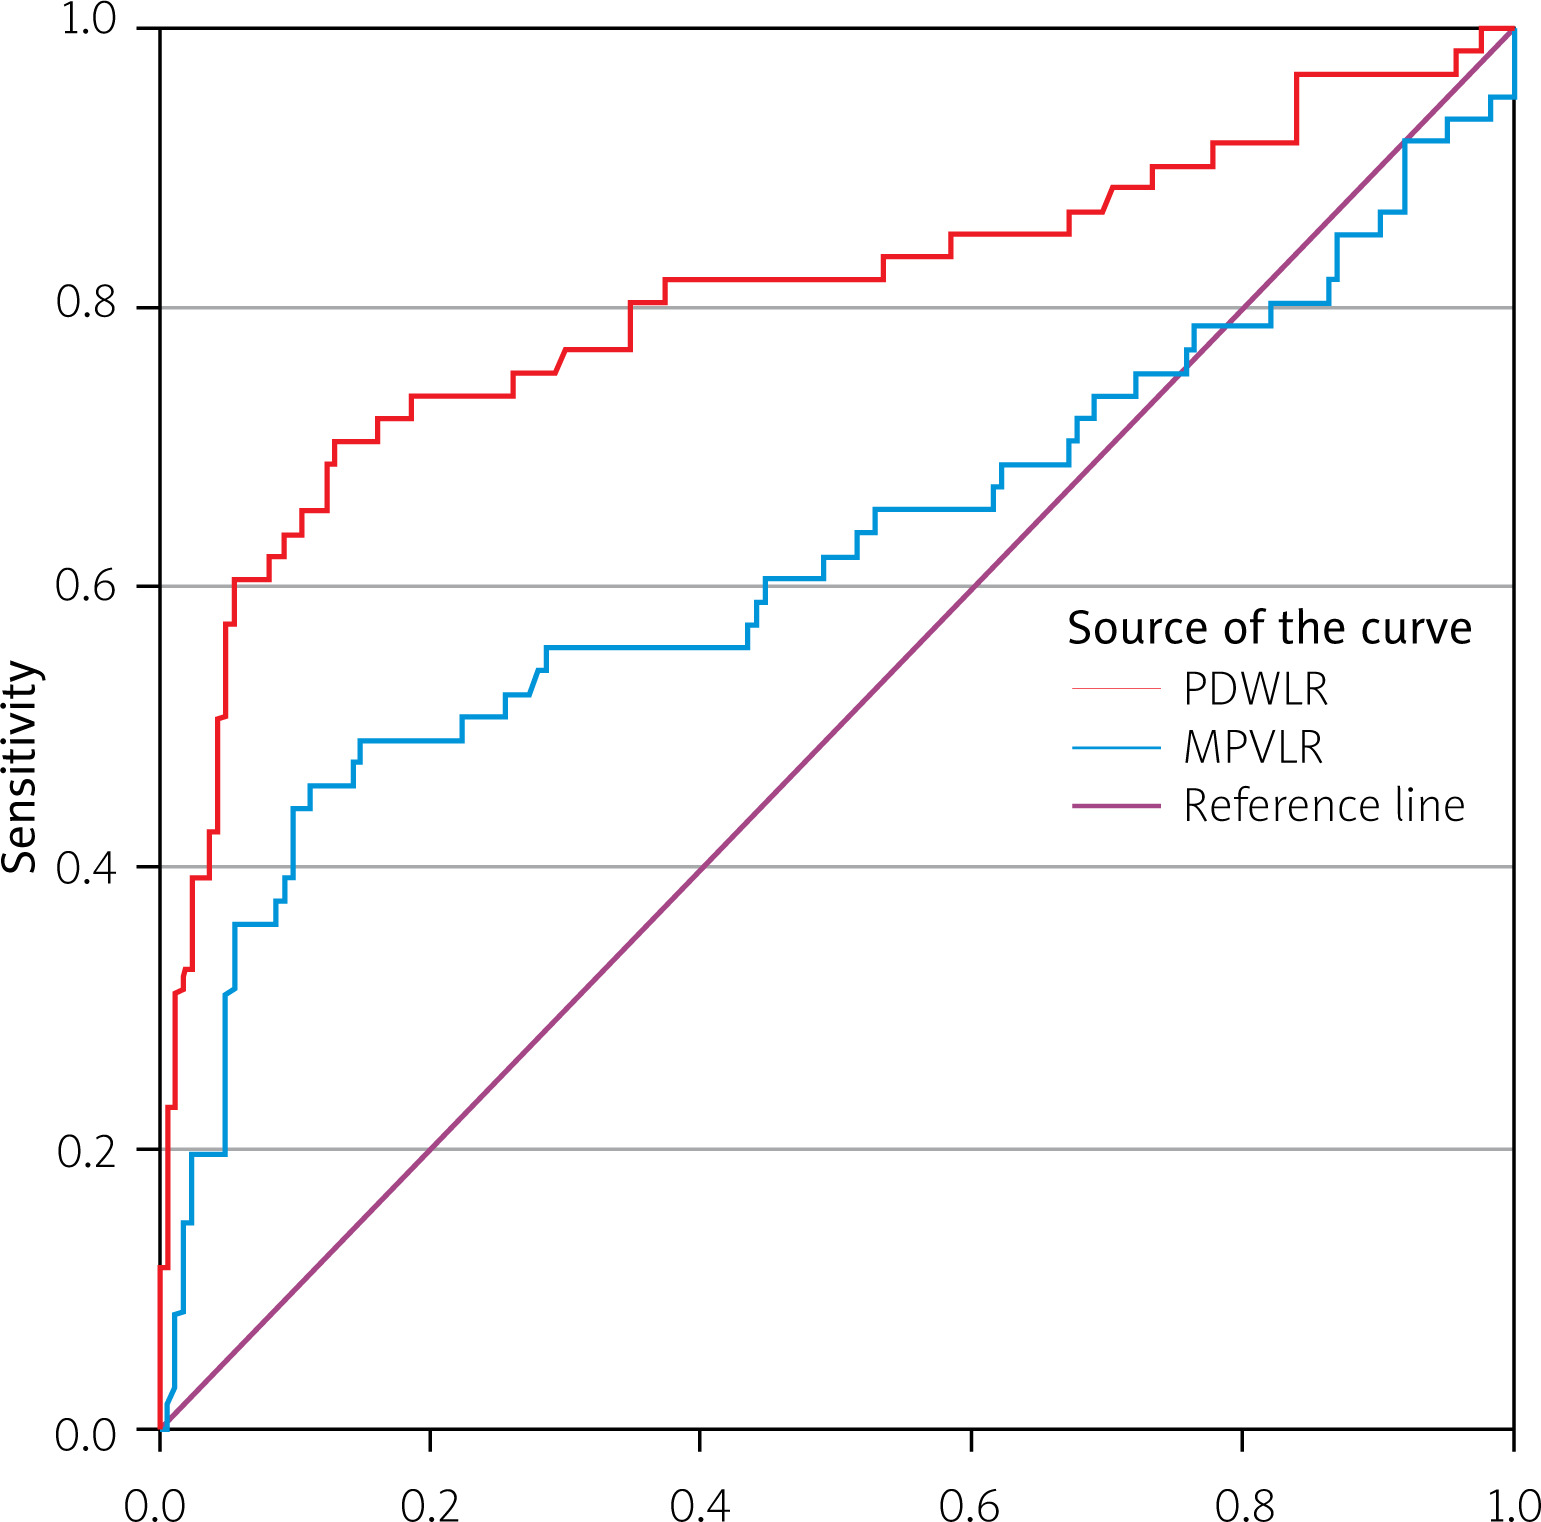
In Table II, the optimum cut-off value of MPVLR that can differentiate SLE patients from controls was > 6.46 with a significant AUC of 0.62, p = 0.011 and highest accuracy 76.8%, sensitivity 45.2%, specificity 88.9%, positive predictive value (PPV) 88.9% and negative predictive value (NPV) 80.9%.
Table II
Validity parameters of mean platelet volume to lymphocyte ratio and platelet distribution width to lymphocyte ratio
| Variables | Optimum cut-off value | AUC | p-value | Sensitivity [%] | Specificity [%] | Accuracy [%] | PPV [%] | NPV [%] |
|---|---|---|---|---|---|---|---|---|
| MPVLR | > 6.46 | 0.62 | 0.011 | 45.2 | 88.9 | 76.8 | 88.9 | 80.9 |
| PDWLR | > 7.53 | 0.81 | < 0.001 | 71.0 | 87.0 | 82.6 | 67.6 | 88.7 |
At the optimum cut-off value of PDWLR that can differentiate SLE patients from controls, which was > 7.53 with a significant AUC of 0.81 (p < 0.001), we got the highest accuracy of 82.6%, sensitivity 71%, specificity 87%, PPV 67.6%, and NPV 88.7%.
Correlations between mean platelet volume to lymphocyte ratio and platelet distribution width to lymphocyte ratio with Systemic Lupus Erythematosus Disease Activity Index
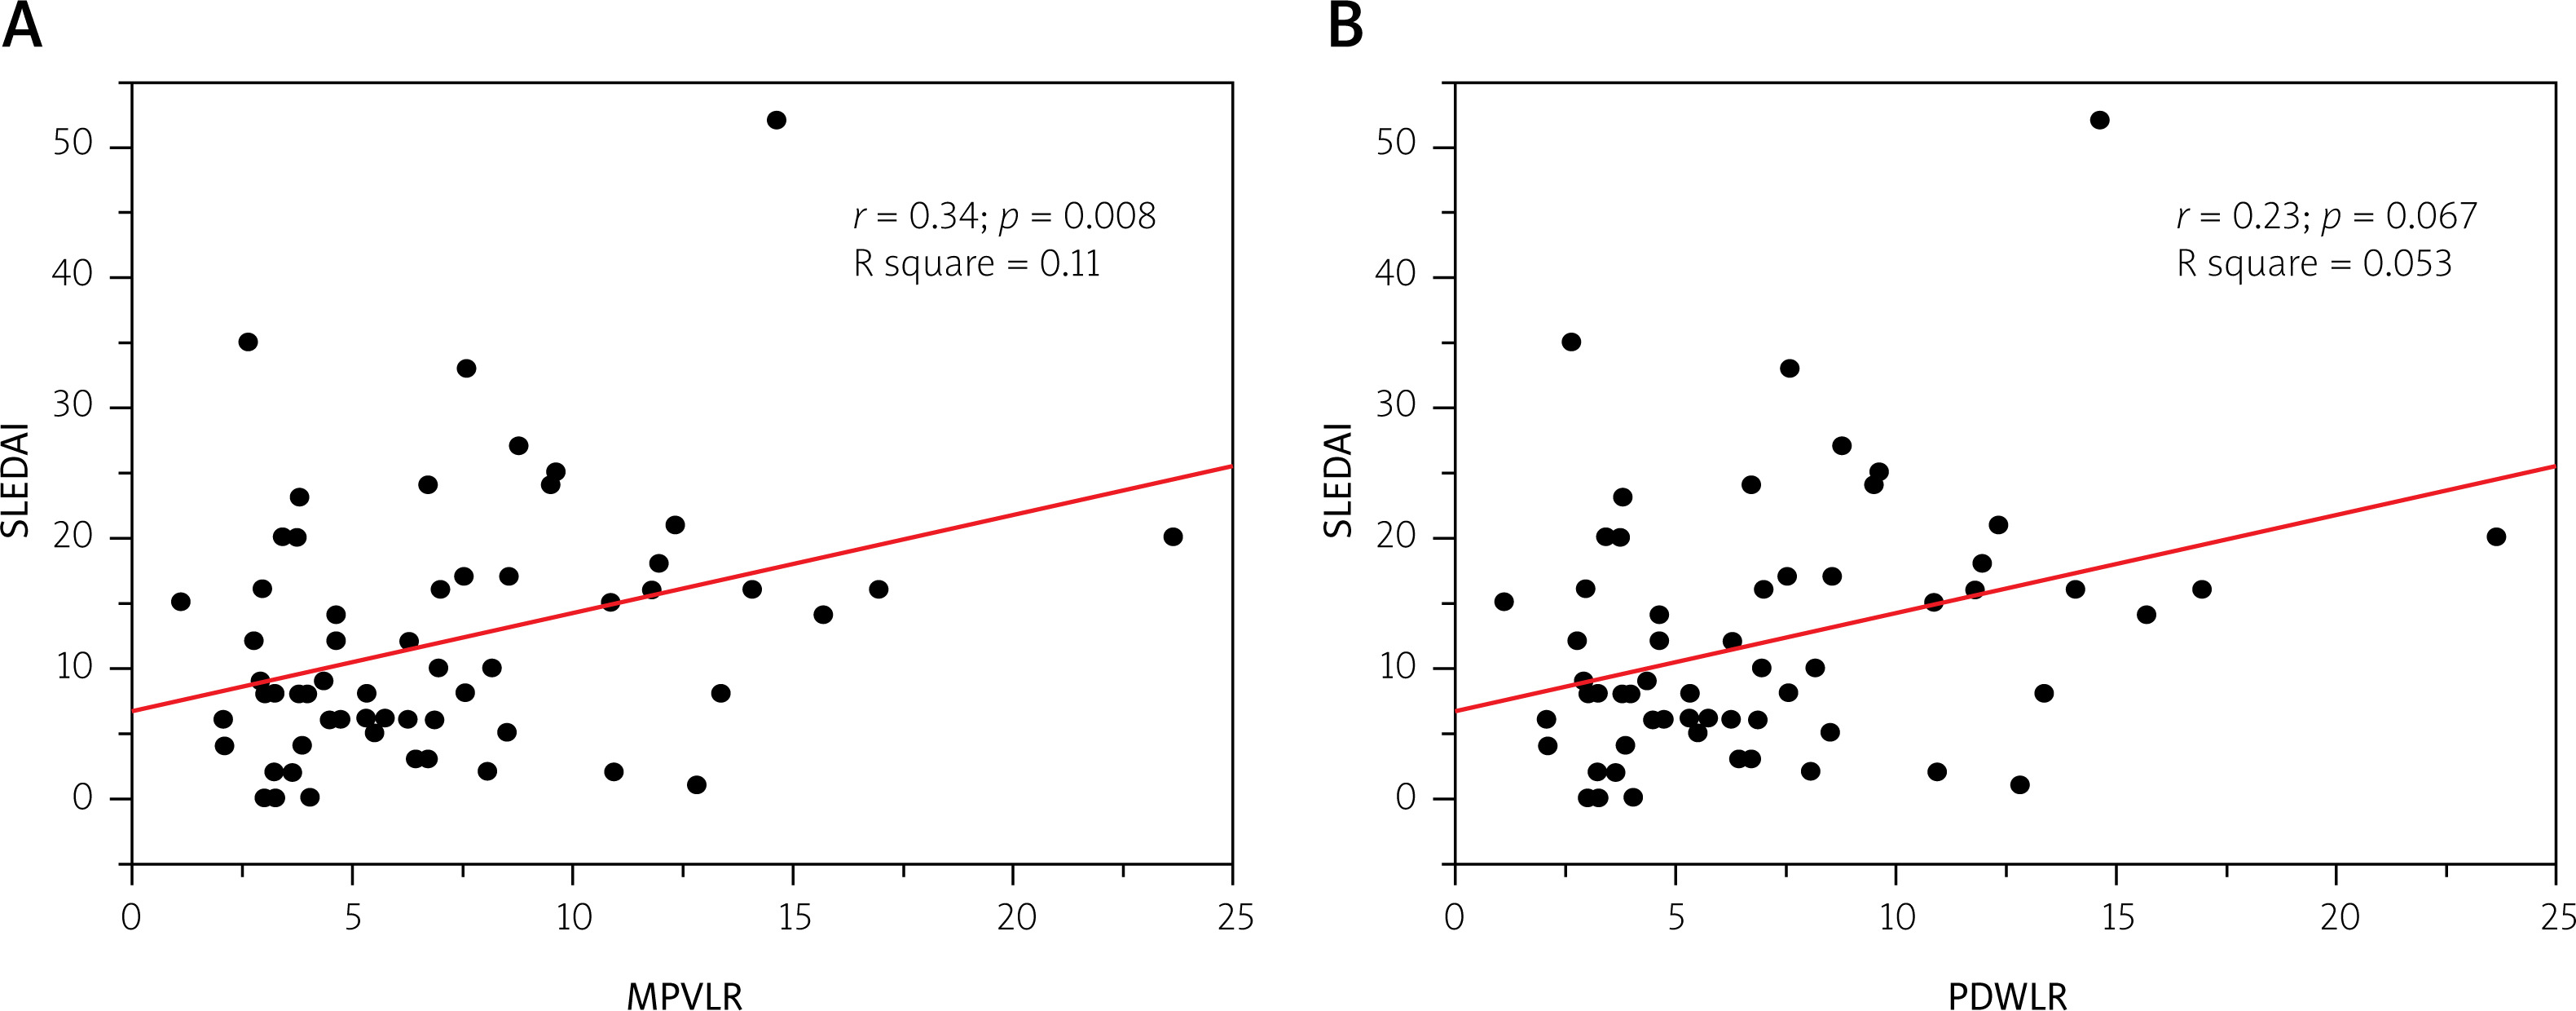
Figure 3 shows a significant positive correlation between MPVLR and SLEDAI (Spearman correlation coefficient r = 0.34, p = 0.008 and rS = 0.11), while no significant correlation between PDWLR with SLEDAI was found (Spearman correlation coefficient r = 0.23, p = 0.067, and rS = 0.053).
Correlation between mean platelet volume to lymphocyte ratio and platelet distribution width to lymphocyte ratio with socio-demographic and clinical features of patients with systemic lupus erythematosus
A significant positive correlation between MPVLR and PDWLR with renal involvement was found (Spearman’s correlation coefficient rS = 0.246, p = 0.038; rS = 0.388, p = 0.002, respectively).
Correlation between mean platelet volume to lymphocyte ratio and platelet distribution width to lymphocyte ratio with some laboratory markers
Figure 4 shows the correlation between MPVLR and PDWLR with some laboratory markers. A statistically significant negative correlation between MPVLR and C3 level (Spearman correlation coefficient rS = –0.260, p = 0.042) and a statistically significant positive correlation between PDWLR and PDW were found (rS = 0.482, p < 0.001).
Discussion
The major outcomes of this study were that the PDWLR and MPVLR of SLE patients and controls were found to be significantly different. The platelet distribution width to lymphocyte ratio was a highly valid significant test that can differentiate SLE patients from controls while MPVLR showed a fair significant validity in this regard.
Also, MPVLR showed a significant weak positive correlation with SLEDAI score. In addition, both of these ratios showed a weak positive significant correlation with renal involvement in SLE patients. Furthermore, PDWLR showed a moderate positive correlation with PDW, while MPVLR showed a weak negative correlation with C3 level.
This is the first research to our knowledge that has examined MPVLR and PDWLR in lupus patients. When the patients’ demographic data in the current study were compared to the healthy control individuals, there was no significant difference. Thus demographic variables were unlikely to confound any observed differences between patients and controls.
According to the findings of this study, females outnumbered males with a percentage of 90.3 with median age of 30.5 years and median disease duration of 3 years with regard to SLE. This was comparable with several studies in Iraq, Egypt, China and Turkey [25–29].
The mean platelet volume to lymphocyte ratio has been suggested as an inflammatory predictor biomarker of several conditions such as diabetic nephropathy and contrast induced nephropathy in patients with acute coronary syndrome after invasive cardiovascular procedures, intravenous immunoglobulin resistance of Kawasaki disease in infants, and also as a predictor of mortality in patients with non-metastatic renal carcinoma treated by nephrectomy, HBV-related decompensated cirrhosis, and gastric cancer [14, 30–34].
On the other hand, PDWLR has been assessed as a tool to predict the severity and risk of death in patients with snake bites, as well as cardiovascular disease risk [15, 16].
However, there is lack in the literature of studies assessing MPVLR and PDWLR in SLE. The measurement of disease activity in SLE patients is a critical stage in the disease’s therapy. Although SLEDAI is the most widely used clinical index, it consists of 24 parameters and some of them are expensive laboratory measures such as anti-dsDNA and complement levels. Therefore, an unprecedented indicator is required to facilitate the assessment of the existing SLE disease activity measures.
By comparing the median values of MPVLR and PDWLR of the SLE patients and controls in the current study, a statistically significant difference in both MPVLR and PDWLR between the two groups was found, with p-values of 0.009 and < 0.001, respectively.
Furthermore, evaluating the validity of these novel biomarkers depending on ROC curve, the PDWLR at the optimum cut-off value of > 7.53 had an optimal specificity of 87%, sensitivity of 71% and an accuracy of 82.6% with an AUC of 0.81 and a p-value of < 0.001. That means PDWLR had good validity to differentiate between the SLE patients and controls, and it may be used with the other available tests aiding in the diagnosis of SLE.
Meanwhile, MPVLR showed a nearly similar specificity of 88.9%, a much lower sensitivity of 45.2%, an accuracy of 76.8% with an AUC equal to 0.62 and a p-value equal to 0.011 at the cut-off value of > 6.46, which suggests that MPVLR had a fair validity in this regard.
SLEDAI score and MPVLR were positively correlated (r = 0.34, p = 0.008), while PDWLR failed to show a significant correlation with this score (r = 023, p = 0.067), which might be related to the relatively small sample size.
Meanwhile, both these two biomarkers had a weak positive correlation with the presence of nephritis in SLE patients with rS = 0.246, p = 0.038 for MPVLR and with rS = 0.388, p = 0.002 for PDWLR.
Furthermore, there was a positive moderate correlation between PDWLR and PDW (rS = 0.482, p < 0.001) and a negative weak correlation between MPVLR and C3 level (rS = –0.260, p = 0.042).
This weak correlation can be related to many factors that can affect this correlation:
the amount of variability or dispersion in the data,
differences in the shapes of the 2 distributions,
lack of linearity,
the presence of 1 or more “outliers”,
the small sample size studied,
measurement error because of variability of sample feature.
The current study was limited by the fact that it was a cross sectional, case-control study conducted in a single center, with a relatively small sample size, that did not allow the confirmation of causality between the MPVLR and PDWLR and activity of SLE. In addition, the relationship between these ratios and molecular biological cytokines was not explored.
However, this was the first study worldwide to assess MPVLR and PDWLR as prospective biomarkers in SLE and their correlation with activity scores. These are affordable and low cost tools with values easily derived by obtaining them from the common complete blood count that is already sent during the evaluation and follow-up of individual SLE patients.
Conclusions
Systemic lupus erythematosus patients had considerably higher MPVLR and PDWLR than controls. The mean platelet volume to lymphocyte ratio showed a weak positive correlation with SLEDAI score and presence of nephritis and a negative weak correlation with complement 3 (C3) level.
In addition, it was a fair and valid test for distinguishing SLE patients from the control group. The platelet distribution width to lymphocyte ratio, on the other hand, had a moderately positive correlation with PDW and a weakly positive correlation with renal involvement.
However, there was no significant correlation with SLEDAI score. But PDWLR showed a highly significant validity assisting in the diagnosis of SLE. In the light of these findings, further larger prospective multicenter studies are needed.