
Introduction
Systemic lupus erythematosus (SLE) is a chronic, multiorgan connective tissue disease characterized by variable dynamics of progression and broad diversity of organ involvement. Annually, SLE affects approximately 5 per 100,000 persons in the United States, and about half as many Europeans and Japanese [1].
Although the genetics, environmental factors, as well as a dysregulation of the immune system are mentioned as the main etiological factors, the exact etiopathogenesis is still uncertain [2, 3]. About one-third of patients experience an ocular manifestation in the course of SLE and it may precede involvement of other organs [4]. Retinopathy, after keratoconjunctivitis sicca, is the second most common eye involvement in SLE [5].
Bashiri et al. [6] found 15.8% prevalence of retinopathy in patients newly diagnosed with ophthalmologically asymptomatic SLE. Diagnoses of retinopathy and less expected, choroidopathy are proven negative prognostic factors for morbidity and mortality. Retinal and choroidal vascular disease may be concomitant to neuropsychiatric lupus and lupus nephritis [7].
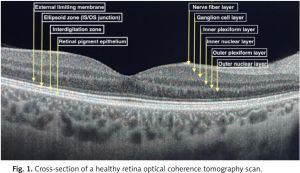
Ophthalmological management of SLE patients is a challenge, because of different causes of eye involvement. It may be the reason for the disease itself, drug induced or due to a secondary disorder. Optical coherence tomography (OCT) is widely used for lupus retinopathy and hydroxychloroquine toxicity screening. Figure 1 presents a cross-section of a healthy retina OCT scan divided into layers.
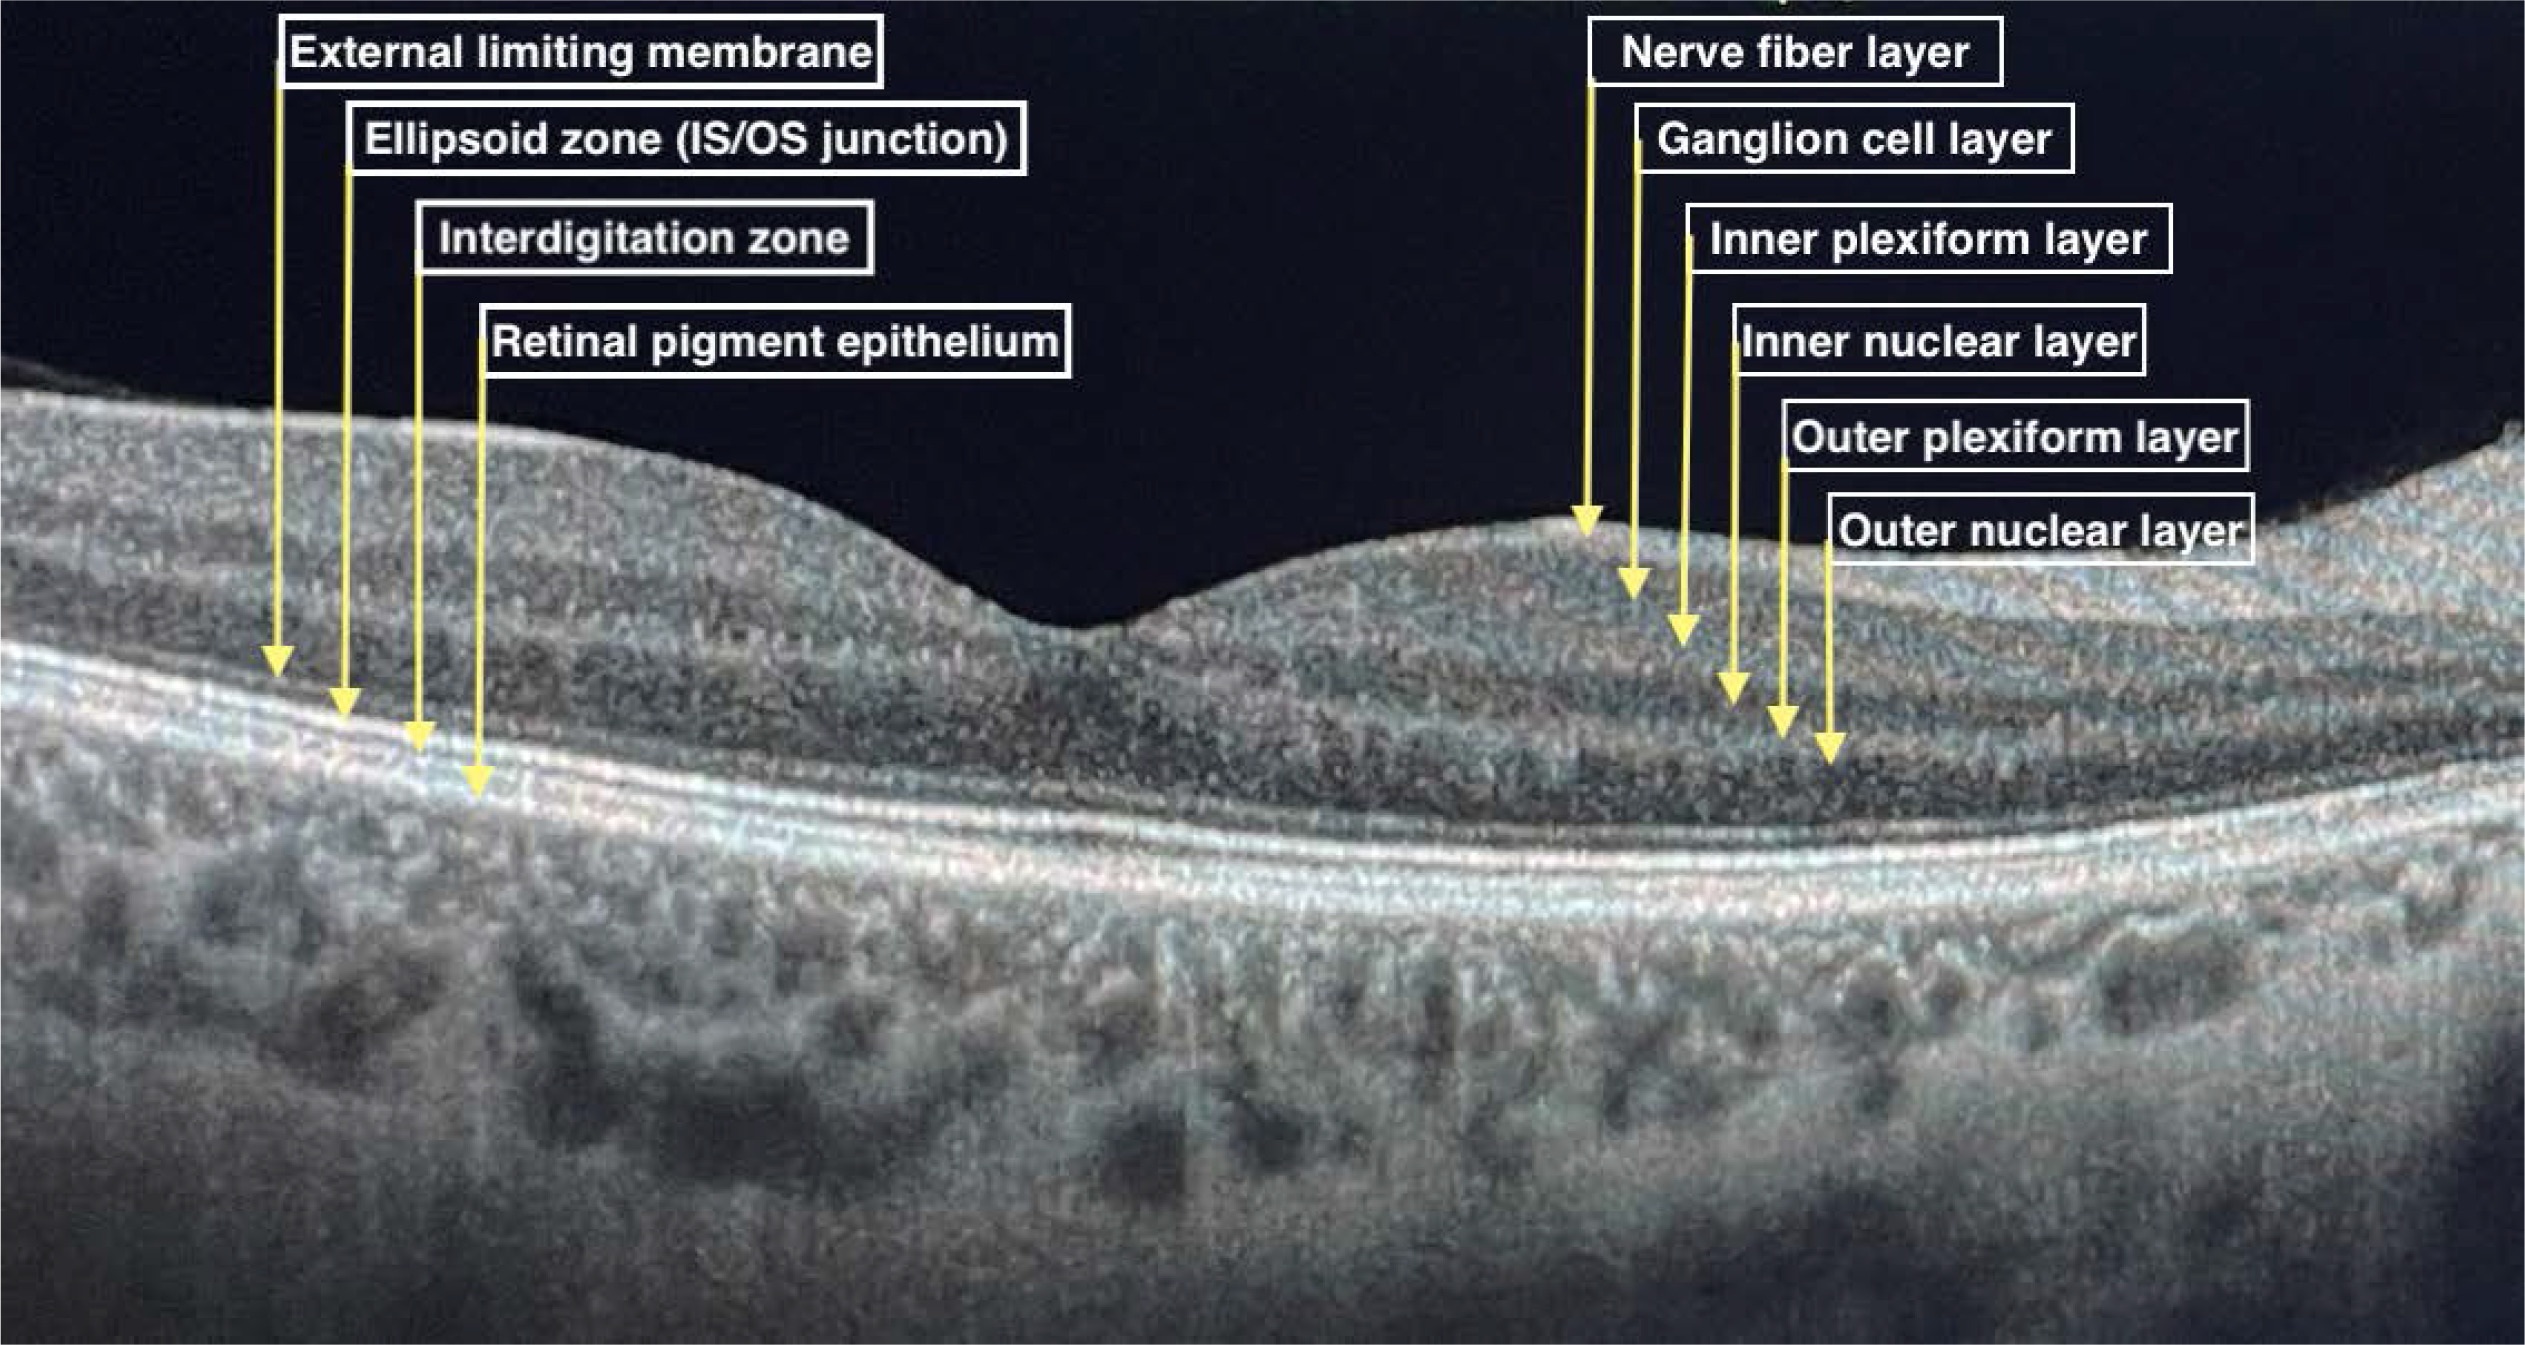
It is a non-invasive device that uses near-infrared light to scan in vivo the posterior pole of the eye to provide high resolution retinal images. Cross-sectional pictures of the whole retina provide comprehensive data about the thickness of all individual layers divided into sections. Optical coherence tomography scans are fast and easy to perform, repeatable and low-cost. Optical coherence tomography is also widely used in glaucoma, macular degeneration and other eye disorders’ diagnostics and follow-up, as well as being useful in multiple sclerosis (MS) and other neurodegenerative diseases [8–10].
Widespread OCT application in SLE patients, which is routinely used at each ophthalmology visit, induced the authors to use the device not only to detect apparent retinal damage, but also to find early, subclinical changes that preceded irreversible impairment and proper lupus retinopathy development.
The aim of the current study was to detect structural retinal abnormalities in OCT in asymptomatic SLE patients without signs of lupus retinopathy or drug toxicity in fundus examination and in OCT. Then, we aimed to assess the relationship between OCT parameters and disease activity, therapy type and burden on other organs to demonstrate the utility of OCT in early retinal impairment in SLE patients.
Material and methods
The study lasted from July 2019 to October 2021. Thirty-three SLE patients (57 eyes), diagnosed according to the American College of Rheumatology/European Alliance of Associations for Rheumatology classification criteria, and 31 healthy individuals (56 eyes) were enrolled in the study. For the study, data of both eyes were collected but averaged for statistical analysis.
Due to the systemic character of the disease, we used averaged data as, in our opinion, they better reflect the impact of SLE. Poor quality of OCT scans resulted in exclusion of 3 patients (4 eyes) from the study. We also excluded patients with evidence of lupus retinopathy or hydroxychloroquine (HCQ) toxicity on OCT or fundus examination on initial evaluation.
All the examined patients were ophthalmologically asymptomatic. Patients with glaucoma and other ocular disorders were excluded from the study as any underlying disease may have an impact on retinal nerve fiber layer (RNFL) thickness measurement. Patients with other eye disorders, over 75 or below 18 years old, with myopia greater than 5 diopters were also excluded from the study. All patients underwent full ophthalmologic examination in a slit lamp including best corrected visual acuity, tonometry, and OCT.
Patients’ laboratory and index results were consulted with an experienced rheumatologist to evaluate the Systemic Lupus Erythematosus Disease Activity Index 2000 (SLEDAI-2K) and the Systemic Lupus International Collaborating Clinics/American College of Rheumatology Damage Index (SLICC/ACR DI).
Optical coherence tomography imaging
Patients from study and control groups underwent a radial OCT B-scan by means of Swept-Source Optical Coherence Tomography Angio (Topcon Corp, Tokyo, Japan, 2015). All patients enrolled in the study had their blood collected for laboratory tests and then the OCT scan was performed within 3 months. Systemic lupus erythematosus pharmacotherapy was not considered during enrollment.
Full retinal thickness, RNFL thickness, ganglion cell layer (GCL) + (GCL with IPL), and GCL++ (RNFL and GCL and IPL) were evaluated in nine Early Treatment Diabetic Retinopathy Study (ETDRS) subfields. All the parameters obtained from scanning were automatically calculated by the device. Retinal thickness, GCL+ and GCL++ were grouped into central subfield (CSF) (circular foveal area with 1 mm diameter), inner ring (average value of four inner quadrants with 3 mm diameter) and outer ring (average value of four outer quadrants with 6 mm diameter).
In the course of neurogenerative diseases such as multiple sclerosis, deterioration of fibers in temporal sector may be seen. Therefore, in this study, the division into sectors typical to the optic nerve was maintained. Retinal nerve fiber layer thickness was evaluated as follows: central, superior, inferior, nasal, temporal quadrants and average of superior, inferior, nasal, and temporal.
Statistical analysis
The statistical analysis was performed using STATISTICA 13.3 (StatSoft, Inc., Tulsa, OK, USA, 2017). The results with p < 0.05 were considered statistically significant. The Kolmogorov-Smirnov distribution test was used to assess the normal distribution in quantitative values. The differences between the individual measured parameters in the groups were analyzed using the Mann-Whitney U test. Spearman’s rank correlation test was used to assess the correlation between the measured parameters and quantitative clinical data.
Results
All the patients from study group were treated with HCQ and 12 of them (12/30) were previously treated with chloroquine that was withdrawn prior to administration of HCQ. Rheumatological treatment data are summarized in Table I. The clinical characteristics of the groups are presented in Table II.
Table I
Systemic lupus erythematosus treatment summary
| Treatment | Positive | Negative |
|---|---|---|
| HCQ Including: HCQ < 5 years/HCQ > 5 years | 30 17/30 | 0 N/A |
| Chloroquine | 12 | 18 |
| Azathioprine | 11 | 19 |
| Methotrexate | 13 | 17 |
Table II
Clinical characteristic of patients
[i] ACL – anti-cardiolipin antibodies IgM and IgG, anti-dsDNA – anti-double stranded DNA antibodies, anti-ß2-GPI – anti-ß2-glycoprotein I antibodies IgM and IgG, ERS – erythrocyte sedimentation rate, HCQ – hydroxychloroquine, IOP – intraocular pressure, SLEDAI-2K – Systemic Lupus Erythematosus Disease Activity Index 2000, SLICC/ACR DI – Systemic Lupus International Collaborating Clinics/American College of Rheumatology Damage Index.
There was no significant difference in sex, age, intraocular pressure, retinal thickness, RNFL, GCL+, GCL++ in all sectors, between SLE patients and healthy controls (HC). Comparison of OCT parameters between study and control groups is summarized in Table III.
Table III
Comparison of optical coherence tomography parameters between study and control groups
Significantly lower (p = 0.019) visual acuity was demonstrated in SLE patients than in the control group. Among the study group a negative correlation was found between disease duration and age and RNFL thickness in the inferior quadrant (p = 0.0063, p = 0.0036). Among the control group a negative correlation was revealed between age and retinal thickness (RT) in the whole outer ring, superior quadrant of RNFL and outer ring of GCL++ (p = 0.0248, p = 0.0136, p = 0.0079).
Kidney involvement was observed in 6 patients in a cohort of SLE patient. The retinal nerve fiber layer in nasal quadrant was increased in patients with SLE and nephritis compared with SLE patients without nephritis (p = 0.02).
No correlations were observed between examined retinal layers parameters and C3, C4, erythrocyte sedimentation rate (ESR), lupus anticoagulant (LAC), anti-nucleosome antibody (ANuA), anti-ß2-glycoprotein I antibodies (anti-b2-GPI) IgM and IgG, anti-double stranded DNA antibodies (anti-dsDNA), anti-cardiolipin antibodies (ACL) IgM and IgG, duration of HCQ therapy, HCQ cumulative dosage, chloroquine cumulative dose, methotrexate, SLICC/ACR and the SLEDAI-2K scores. Azathioprine was associated with lower RNFL thickness in inferior and nasal quadrants. Comparison of OCT parameters among SLE patients based on HCQ duration and chloroquine use are presented in Tables IV and V.
Table IV
Comparison of optical coherence tomography parameters – subgroups based on hydroxychloroquine duration
Table V
Comparison of optical coherence tomography parameters – subgroups based on chloroquine use
Data about the impact of central nervous system (CNS) involvement, leflunomide (1 patient), cyclophosphamide (4 patients), rituximab (1 patient) and prednisolone (3 patients) therapy on retinal microstructure were also collected. Because of the small sample size from these subgroups, these results were unreliable.
Discussion
Retinal structures, especially RNFL and GCL, may be altered in the course of the disease or administered treatment [9]. Systemic lupus erythematosus is an insidious entity and, even though advanced retinal injuries are visible in OCT scans, they do not cause visible changes in the retina in a standard ophthalmological examination in the subclinical stage.
Over time, visual acuity decreases significantly and alterations in the fundus become apparent, but then treatment is difficult, and the visual outcomes are often unsatisfactory. Finding a solid biomarker used for early SLE diagnosis, disease monitoring and preceding exacerbation of the disease has been a purpose of many research studies [11].
Our study revealed no difference between SLE and HC groups in retinal thickness, RNFL, GCL+, GCL++, and no correlation between OCT parameters and disease activity and therapy type. The results of Fouad et al. [12] were comparable to ours. In their study, no significant correlation between disease activity and OCT abnormalities were detected. Optical coherence tomography was able to detect only significant changes that resulted from HCQ therapy longer than 5 years. The study showed that OCT is not able to detect subtle changes in early retina involvement [12].
In many neurogenerative disorders, such as Parkinson disease, Alzheimer disease, multiple sclerosis and schizophrenia, RNFL thinning is observed [13]. Our study found a negative correlation between disease duration and RNFL thickness in the inferior quadrant, but there was no significant difference in RNFL thickness between SLE patients and HC.
Conigliaro et al. [14] revealed thinning in the temporal-inferior quadrant of RNFL in a cohort of SLE patients with neuropsychiatric involvement. In our study, because of the small sample size, data about the impact of CNS involvement on OCT abnormalities were not significant.
Liu et al. [9] detected significant RNFL thinning in global, temporal superior and nasal quadrants in NPSLE (neuropsychiatric systemic lupus erythematosus) patients compared to the control group. This correlation was not confirmed in NPSLE patients compared to the non-NPSLE group. It supports the thesis that NPSLE patients, as well as non-NPSLE, differ from healthy controls and had some early abnormalities in RNFL thickness.
As confirmation, the authors also found a correlation between the cognitive function test and thickness of the temporal quadrant of the RNFL. According to the aforementioned authors, abnormalities in OCT parameters, in the form of RNFL thinning, may be indicative of cognitive impairment in SLE and may serve as an early biomarker. They also suggest that changes in the CNS in SLE patients are more common, which reflects on RNFL thinning in the whole SLE group, not only in the NPSLE cohort specifically.
Retinal nerve fiber layer thinning may by the reason for RNFL microinfarcts because of immune complex deposition in retinal vessel walls [15]. A correlation between RNFL thinning and white matter damage was suspected, but it was not confirmed [16].
Bao et al. [17] also revealed decreased RNFL thickness compared to controls. In the non-lupus retinopathy group, it was evaluated in superior and nasal quadrants, and in patients with confirmed lupus retinopathy additionally in the inferior region.
In contrast, Işık et al. [18] did not find a difference in RNFL thickness in the SLE group compared to the control one. The study authors included all SLE patients, not only NPSLE patients.
Hydroxychloroquine therapy is considered safe with good disease control but associated with dose-dependent toxicity [6]. Hydroxychloroquine retinopathy tends to increase with long-term therapy (5 or more years), high daily dose (more than 5 mg/kg per day), chronic renal disease, use of tamoxifen and preexisting retinal or macular disease [6–8].
Early retinopathy detection is crucial to prevent vision-threatening complications. The timetable for HCQ toxicity screening, for patients with no risk factors, includes baseline fundus examination to detect coexistent retinal disease and annual screening after 5 years from SLE diagnosis [6].
Primary screening tests are automated visual fields (standard automated perimeter) and spectral-domain optical coherence tomography (SD OCT), as well as the multifocal electroretinogram (mfERG) and fundus autofluorescence (FAF). In our study, we divided the SLE group based on the duration of HCQ therapy.
Conigliaro et al. [14], in their study, did not observe HCQ toxicity in OCT in SLE patients. In our study also no significant changes were observed in OCT parameters based on the duration of HCQ therapy and HCQ cumulative dosage. The authors detected functional alterations rather than morphological ones. It seems that standard automated perimetry better reflects subclinical changes in the SLE cohort group than OCT. According to the authors, changes in perimetry were possibly associated with nephritis.
In the current study there was no significant difference in GCL+ and GCL++ thickness between SLE patients and HC. However, Işık et al. [18] observed thinner GC-IPL and mean macular thickness in the SLE group compared to HC. Bao et al. [17] compared lupus retinopathy and non-lupus retinopathy patients with HC and found decreased temporal GCL+ in the NLR group and decreased central, superior, temporal, and inferior GCL+ in lupus retinopathy. Compared to non-lupus retinopathy, GCL+ in the temporal and inferior quadrants of lupus retinopathy patients was associated with further thickness reduction. At the early stage of lupus retinopathy, microstructure of the retina seen in OCT is not so vulnerable to disease fluctuation to detect subclinical disease.
Average RT, in the 1 mm center and in the whole 6 mm ring (including the inner and outer ring), was similar in study and control groups. Our results are accordant with Conigliaro et al. [14], who found similar RT in SLE and control groups. Interestingly, they detected a reduction in retinal thickness exclusively in Sjögren’s syndrome patients compared to both control group and SLE patients.
In contrast to our study, Liu et al. [9] observed lower mean macular thickness in patients with SLE and Bao et al. [17] found decreased RT in the temporal region in the non-lupus retinopathy group and in the superior, temporal, inferior and nasal regions in patients with lupus retinopathy.
Thinning of the retinal layers such as the RNFL and GCL is a confirmed, age-related alteration in retinal microstructure [19]. Our study confirmed a negative correlation between age and RNFL in the inferior quadrant in the study group and between age and retinal thickness in the whole outer ring, the superior quadrant of the RNFL and the outer ring of GCL++ among the control group.
All the patients from the study group were treated with HCQ, making the study cohort homogeneous. Hydroxychloroquine has a protective effect on the course of SLE, and studies show that HCQ might have a protective effect on ocular microvasculature [20].
Another novel, promising method for diagnosis of subclinical retinal alterations is optical coherence tomography angiography (OCTA). It scans the retina in a non-contact way and provides data about retinal vessels and the status of all the retina layers in easy to follow-up images and quantitative data. Introduction of OCTA was a milestone in ophthalmology and, in the authors’ opinion, may replace fundus fluorescein angiography entirely. Recent papers have pointed out the potential of OCTA in early subclinical microvasculature changes in SLE patients [14, 17, 18, 20–25].
The biggest strengths of the study are the evaluation of different retinal layers divided into sectors and big rheumatological data.
Study limitations
This study is not free of limitations, including the small sample size, small number of patients with kidney and CNS involvement, lack of follow-up data, absence of standard automated perimetry data and lack of choroidal thickness.
Conclusions
In the current study we did not find any subclinical morphological differences in OCT between SLE patients and the healthy control group. Despite its well-established position in neurodegenerative diseases, RNFL thickness in SLE patients did not differ significantly from the control group. Optical coherence tomography is a widespread ophthalmic modality used for SLE retinopathy and HCQ toxicity screening.
Presented research did not demonstrate its clinical potency in diagnosis of subclinical retinal involvement. The optical coherence tomography device seems to be less sensitive in subclinical retinal impairment detection than OCTA.
In patients with SLE and non-lupus retinopathy, changes in microstructure of the retina are not evident in OCT, in contrast to changes in microvasculature in OCTA. The role of optical coherence tomography in ophthalmology is well established and our study did not change this status.