
Introduction
Rheumatoid arthritis (RA) and psoriatic arthritis (PsA) are chronic inflammatory diseases that are characterized by synovial joint inflammation [1, 2]. The wrist and hand are common sites for involvement in both disease entities and the definite diagnosis is based mainly on associated clinical findings [3]. However, it is sometimes difficult even for the well-trained rheumatologist to differentiate between these two conditions especially in the absence of positive immunologic tests, skin lesions and the other typical manifestations of spondylarthritis [4].
Use of imaging modalities can provide important information to help practitioners to identify types of arthritis [5]. Conventional radiography, ultrasound (US) and magnetic resonance imaging are the commonly used imaging methods for arthritis [6]. Conventional radiography is available and quick but cannot depict changes found early in the disease such as synovitis [5]. Magnetic resonance imaging provides soft tissue resolution, but it is costly and not available everywhere [7].
Musculoskeletal ultrasound (MSUS) has been introduced as a valuable simple imaging tool for arthritis [8]. It is a noninvasive tool capable of imaging the bone contours, synovial membrane, and tendons [9].
To our knowledge, only few studies have been performed comparing US findings of the wrist and hand in patients with RA and PsA [4, 9]. Therefore, the aims of the present study were to compare hand and wrist MSUS between RA and PsA patients, and correlate US findings in these two entities with clinical, laboratory and disease activity indices.
Material and methods
Patients
A cross-sectional, observational study was carried out on consecutive 20 RA and 15 PsA patients who attended the Rheumatology and Immunology Unit (outpatient and inpatient), Mansoura University during the period from May 2017 to April 2018, following approval from Mansoura Faculty of Medicine Institutional Research Board (MFM-IRB), Egypt (no. MS/17.05.124).
The inclusion criteria included the following:
age > 18 years,
fulfillment of the American College of Rheumatology (ACR)/European League Against Rheumatism (EULAR) 2010 classification criteria for RA patients and Classification criteria for PsA (CASPAR) for PsA patients [10, 11],
symptomatic involvement of at least one of the hand and wrist joints for > 6 weeks.
Subjects were not included if they had other associated rheumatic disease, history of hand or wrist surgical procedures or diseases infection, amputation or injury of any digit. In addition, RA patients with a family history of psoriasis of first- or second-degree relatives or current/past evidence of skin/nail psoriasis were also excluded. The study participants signed consent forms after receiving oral and written information.
Clinical assessment
Baseline data were collected by the same rheumatologist via patient interview. They included demographic and clinical data involving age, sex, duration of the disease and the length of morning stiffness. Also, current treatment with disease-modifying antirheumatic drugs as well as biological agents was recorded.
Clinical examination was performed to assess the swollen and tender joints. A visual analogue scale (VAS) of 100 mm was used to record the general health of the patient with 0 = best and 100 = worst. Additionally, acute phase reactants at the time of the study, i.e. C-reactive protein (CRP) and erythrocyte sedimentation rate (ESR), were recorded.
For evaluation of current disease activity, the disease activity score 28 (DAS28-ESR) was calculated for each RA patient while the Disease Activity Index for Psoriatic Arthritis (DAPSA) score was calculated for each PsA patient [12, 13].
Ultrasound assessment
The ultrasound examination was performed using an EDAN U2 US device (Shenzhen, China) equipped with a 8–13.4 MHz linear array transducer. Ultrasound settings were standardized during the entire study. Ultrasound examination was performed at the same day of clinical assessment in a darkened room by a well-trained rheumatologist who was blinded to the clinical data.
Each patient was made to sit on a chair with both wrists and hands on a pillow over the examination couch. Grey scale (B mode) examinations were performed in a standardized manner according to the guidelines of EULAR [14].
In each hand, the dorsal and volar joint regions of the wrist (distal radioulnar, midcarpal, radiocarpal) in addition to the dorsal and palmar joint regions of the first to the fifth metacarpophalangeal (MCP) joints, the second to the fifth proximal interphalangeal (PIP) joints and the first to the fifth distal interphalangeal (DIP) joints were examined in long (sagittal plane) and short (axial plane) axes. The interphalangeal joint of first digit was considered as the DIP joint.
In addition, flexor and extensor tendon sheaths of the wrist and fingers were scanned. Extensor tendons of the wrist were examined from Lister’s tubercle to the metacarpal bones while flexor tendons at the wrist were examined from the proximal edge of the carpal tunnel to the palm of the hand. Outcome Measures in Rheumatology definitions were used to assess joints for synovial hypertrophy, joint effusion and erosions [15].
Synovial hypertrophy was scored on a semiquantitative scale (where 0 = absence, 1 = mild, 2 = moderate, and 3 = severe). Joint effusion was also graded as the following: 0 = absence, 1 = minimal, 2 = moderate and 3 = severe. Bone erosions were scored as: 0 = normal, 1 = unifocal, not more than one erosion per quadrant, 2 = multifocal, 1–3 erosions per quadrant and 3 = massive, more than 3 erosions per quadrant. Normal tendon sheaths were recorded as negative (0) and tenosynovitis was recorded as positive (1).
Statistical analysis
Data were analyzed using the SPSS program for Windows (Standard version 21). The normality of data was first tested with the one-sample Kolmogorov-Smirnov test.
Qualitative data were described using number and percent. Associations between categorical variables were tested using the χ2 test while Fisher’s exact test and the Monte Carlo test were used when a cell count less than 5 was expected. Continuous variables were presented as mean ±SD (standard deviation) for parametric data and median (min–max) for non-parametric data. The two groups were compared with the independent samples Student t-test for parametric data and the Mann-Whitney U test for non-parametric data. Statistical significance was defined as p ≤ 0.05.
Results
The baseline demographic and clinical and therapeutic characteristics of the 2 groups of patients are summarized in Table I. There were no significant differences between the groups regarding age, male-to-female ratio, disease duration or activity. Patients with RA had longer morning stiffness while PsA patients had higher CRP, tender joint count (TJC) and swollen joint count (SJC).
Table I
Demographic and clinical data among the studied rheumatoid arthritis and psoriatic arthritis patients
| Variable | RA group (n = 20) | PsA group (n =1 5) | p-value |
|---|---|---|---|
| Age, years (mean ±SD) | 40.95 ±10.90 | 44.20 ±10.75 | 0.386 |
| Gender | |||
| Males [n (%)] | 5 (25) | 5 (33.3) | 0.589 |
| Females [n (%)] | 15 (75) | 10 (66.7) | |
| Disease duration, years, median (min–max) | 5 (2–15) | 7.00 (2–16) | 0.104 |
| Morning stiffness, minutes (mean ±SD) | 50.83 ±13.74 | 30.45 ±12.13 | < 0.001* |
| TJC, median (min–max) | 9 (1–14) | 13.00 (4.00–18.00) | 0.001* |
| SJC, median (min–max) | 4.5 (0–10) | 8.0 (2–16) | 0.002* |
| VAS, median (min–max) | 50 (30–80) | 50 (30–70) | 0.931 |
| ESR [mm/h] (mean ±SD) | 42.25 ±13.99 | 36.86 ±13.22 | 0.257 |
| CRP [mg/dl] (mean ±SD) | 15.35 ±7.09 | 21 ±7.83 | 0.033* |
| Activity scores | |||
| DAS28 (mean ±SD) | 5.40 ±0.99 | – | |
| DAPSA (mean ±SD) | – | 33.56 ±8.88 | |
| Level of disease activity | |||
| Mild [n (%)] | 4 (20.0%) | 1 (6.7%) | 0.727 |
| Moderate [n (%)] | 6 (30.0%) | 4 (26.7%) | 0.911 |
| Severe [n (%)] | 10 (50.0%) | 10 (66.7%) | 0.918 |
| Synthetic DMARDs | |||
| Methotrexate | 13 (65%) | 8 (53.3%) | 0.486 |
| Hydroxychloroquine | 12 (60%) | 0 (0%) | < 0.001* |
| Leflunomide | 12 (60%) | 3 (20%) | 0.018* |
| Steroids | 8 (40%) | 0 (0%) | 0.006* |
| Sulfasalazine | 3 (15%) | 11 (73.3%) | < 0.001* |
| Biological DMARDs | 3 (15%) | 4 (26.7%) | 0.430 |
CRP – C-reactive protein, DAPSA – disease activity index for psoriatic arthritis, DAS – disease activity score, DMARDs – disease modifying antirheumatic drugs, ESR – erythrocyte sedimentation rate, PsA – psoriatic arthritis, RA – rheumatoid arthritis, SJC – swollen joint count, TJC – tender joint count, VAS – visual analogue scale
The frequency of US findings at the studied joint recesses is given in Table II.
Table II
Ultrasound detected synovial hypertrophy, joint effusion and erosions at the wrist and hand joints of the studied rheumatoid arthritis and psoriatic arthritis groups
| Name of structure | Synovial hypertrophy | Joint effusion | Joint erosions | ||||||
|---|---|---|---|---|---|---|---|---|---|
| RA group (n = 40 hands) [n (%)] | PsA group (n = 30 hands) [n (%)] | p-value | RA group (n = 40 hands) [n (%)] | PsA (n = 30 hands) [n (%)] | p-value | RA group (n = 40 hands) [n (%)] | PsA group (n = 30 hands) [n (%)] | p-value | |
| DRUJ | 21 (52.5) | 8 (26.7) | 0.029* | 14 (35) | 5 (16.7) | 0.088 | 11 (27.5) | 4 (13.3) | 0.153 |
| RCJ | 28 (70) | 14 (46.7) | 0.05 | 17 (42.5) | 6 (20) | 0.047* | 18 (45) | 6 (20) | 0.029* |
| MCJ | 19 (47.5) | 11 (36.7) | 0.364 | 8 (20) | 1 (3.3) | 0.039* | 13 (32.5) | 7 (23.3) | 0.401 |
| MCP1 | 13 (32.5) | 8 (26.7) | 0.598 | 2 (5) | 4 (13.3) | 0.391 | 6 (15) | 5 (16.7) | 0.850 |
| MCP2 | 23 (57.5) | 16 (53.3) | 0.728 | 9 (22.5) | 5 (16.7) | 0.546 | 10 (25) | 5 (16.7) | 0.701 |
| MCP3 | 21 (52.5) | 14 (46.7) | 0.629 | 9 (22.5) | 5 (16.7) | 0.546 | 6 (15) | 6 (20) | 0.583 |
| MCP4 | 17 (42.5) | 13 (43.3) | 0.944 | 7 (17.5) | 6 (20) | 0.790 | 6 (15) | 4 (13.3) | 0.536 |
| MCP5 | 9 (22.5) | 4 (13.3) | 0.329 | 4 (10) | 1 (3.3) | 0.383 | 9 (22.5) | 3 (10) | 0.170 |
| PIP2 | 13 (32.5) | 9 (30) | 0.823 | 4 (10) | 4 (13.3) | 0.717 | 5 (12.5) | 6 (20) | 0.394 |
| PIP3 | 17 (42.5) | 13 (43.3) | 0.944 | 4 (10) | 5 (16.7) | 0.410 | 5 (12.5) | 5 (16.7) | 0.622 |
| PIP4 | 13 (32.5) | 10 (33.3) | 0.941 | 1 (2.5) | 6 (20) | 0.037* | 5 (12.5) | 8 (26.7) | 0.131 |
| PIP5 | 8 (20) | 8 (26.6) | 0.511 | 2 (5) | 4 (13.3) | 0.391 | 7 (17.5) | 2 (6.7) | 0.180 |
| DIP1 | 0 (0) | 9 (30) | < 0.001* | 0 (0) | 3 (10) | 0.074 | 2 (5) | 6 (20) | 0.051 |
| DIP2 | 0 (0) | 6 (20) | 0.003* | 0 (0) | 0 (0) | – | 2 (5) | 8 (26.7) | 0.01* |
| DIP3 | 0 (0) | 8 (26.6) | 0.001* | 0 (0) | 0 (0) | – | 1 (2.5) | 10 (33.3) | < 0.001* |
| DIP4 | 0 (0) | 5 (16.6) | 0.007* | 0 (0) | 0 (0) | – | 2 (5) | 8 (26.7) | 0.01* |
| DIP5 | 0 (0) | 3 (10) | 0.041* | 0 (0) | 0 (0) | – | 1 (2.5) | 3 (10) | 0.181 |
| Total | 202/680 (29.7) | 159/510 (31.2) | 0.585 | 80/680 (11.7) | 55/510 (10.8) | 0.595 | 110/680 (16.2) | 96/510 (18.8) | 0.232 |
In 20 RA and 15 PsA patients, a total of 680 and 510 wrist and hand joints were evaluated sonographically. Abnormal synovial hypertrophy was observed in 202 (29.7%) and 159 (31.2%) joint recesses in the RA and PsA patients respectively. Synovial hypertrophy was more frequently detected at the distal radioulnar joint (DRUJ) in RA patients (52.5% vs. 26.7% respectively, p = 0.029) and at the DIP joints exclusively in PsA patients.
Effusion was detected in 80 (11.7%) and 55 (10.8%) joint recesses in the RA and PsA patients respectively. Radiocarpal joint (RCJ) and midcarpal joint (MCJ) effusion was significantly more often found in RA in comparison with PsA patients (p = 0.047 and 0.039 respectively) while PIP 5 effusion was significantly more often present in PsA compared with RA patients (20% vs. 2.5% respectively, p = 0.037). Joint erosions were discovered in 110 (16.2%) of the scanned joints in RA and 96 (18.8%) in PsA patients (p = 0.232). They were significantly more often detected at the RCJ in RA (p = 0.029) and the DIP joints in PsA (p = 0.01).
Semiquantitative scoring of US detected synovial hypertrophy showed significantly more severe lesions in RA than in PsA (p = 0.003) especially at the joint recesses of RCJ and MCJ (p = 0.039 and 0.024 respectively).
Regarding joint effusion, there was no significant difference of semiquantitative scoring except at PIP joints, which showed a more severe grade in PsA than RA patients (p = 0.017). Although there was no significant difference in the grading of joint erosions between RA and PsA groups, erosions at the DIP joints exhibited a more severe score in the PsA group (p < 0.001), as shown in Table III.
Table III
Semiquantitative scoring of ultrasound detected synovial hypertrophy, joint effusion and erosions in the studied rheumatoid arthritis and psoriatic arthritis patients
| Name of structure | Synovial hypertrophy | Joint effusion | Joint erosions | ||||||
|---|---|---|---|---|---|---|---|---|---|
| RA group (n = 40 hands) [n (%)] | PsA group (n = 30 hands) [n (%)] | p-value | RA group (n = 40 hands) [n (%)] | PsA group (n = 30 hands) [n (%)] | p-value | RA group (n = 40 hands) [n (%)] | PsA group (n = 30 hands) [n (%)] | p-value | |
| DRUJ | |||||||||
| G0 | 19 (47.5) | 22 (73.3) | 26 (65) | 25 (83.3) | 29 (72.5) | 26 (86.7) | |||
| G1 | 3 (7.5) | 2 (6.7) | 0.165 | 11 (27.5) | 3 (10) | 0.236 | 5 (12.5) | 2 (6.7) | 0.502 |
| G2 | 15 (37.5) | 5 (16.7) | 2 (5) | 2 (6.7) | 5 (12.5) | 2 (6.7) | |||
| G3 | 3 (7.5) | 1 (3.3) | 1 (2.5) | 0 (0) | 1 (2.5) | 0 (0) | |||
| RCJ | |||||||||
| G0 | 12 (30) | 16 (53.3) | 23 (57.5) | 24 (80) | 22 (55.) | 24 (80) | |||
| G1 | 6 (15) | 4 (13.3) | 0.039* | 5 (12.5) | 4 (13.3) | 0.051 | 8 (20) | 2 (6.7) | 0.147 |
| G2 | 14 (35) | 10 (33.3) | 12 (30) | 2 (6.7) | 9 (22.5) | 3 (10) | |||
| G3 | 8 (20) | 0 (0) | 0 (0) | 0 (0) | 1 (2.5) | 1 (3.3) | |||
| MCJ | |||||||||
| G0 | 21 (52.5) | 19 (63.3) | 32 (80) | 29 (96.7) | 27 (67.5) | 23 (76.7) | |||
| G1 | 6 (15) | 9 (30) | 0.024* | 7 (17.5) | 0 (0) | 0.054 | 6 (15.0) | 3 (10) | 0.725 |
| G2 | 13 (32.5) | 2 (6.7) | 1 (2.5) | 1 (3.3) | 6 (15.0) | 4 (13.3) | |||
| G3 | 0 (0) | 0 (0) | 0 (0%) | 0 (0) | 1 (2.5) | 0 (0) | |||
| MCPJ | |||||||||
| G0 | 117 (58.5) | 95 (63.3) | 169 (84.5) | 129 (86) | 163 (81.5) | 127 (84.7) | |||
| G1 | 22 (11.0) | 18 (12) | 0.551 | 21 (10.5) | 12 (8) | 0.633 | 20 (10.0) | 9 (6) | 0.600 |
| G2 | 45 (22.5) | 30 (20) | 9 (4.5) | 9 (6) | 15 (7.5) | 12 (8) | |||
| G3 | 16 (8.) | 7 (4.7) | 1 (0.5) | 0 (0) | 2 (1.0) | 2 (1.3) | |||
| PIPJ | |||||||||
| G0 | 109 (68.13) | 80 (66.7) | 142 (94.7) | 101 (84.2) | 136 (85) | 99 (82.5) | |||
| G1 | 18 (11.25) | 9 (7.5) | 0.606 | 7 (4.6) | 16 (11.3) | 0.017* | 16 (10.) | 10 (8.3) | 0.409 |
| G2 | 30 (18.75) | 28 (23.3) | 1 (0.7) | 3 (2) | 6 (3.7) | 10 (8.3) | |||
| G3 | 3 (1.87) | 3 (2.5) | 0 (0) | 0 (0) | 2 (1.3) | 1 (0.8) | |||
| DIPJ | |||||||||
| G0 | 200 (100) | 119 (79.3) | 200 (100) | 147 (98) | 193 (96.5) | 115 (76.7) | |||
| G1 | 0 (0) | 27 (18) | < 0.001* | 0 (0) | 2 (1.3) | 0.133 | 5 (2.5) | 28 (18.7) | < 0.001* |
| G2 | 0 (0) | 3 (2) | 0 (0) | 1 (0.7) | 2 (1) | 7 (4.7) | |||
| G3 | 0 (0) | 1 (0.7) | 0 (0) | 0 (0) | 0 (0) | 0 (0) | |||
| Total | |||||||||
| G0 | 478 (70.3) | 351(68.8) | 600 (88.2) | 455 (89.2) | 570 (83.3) | 414 (81.2) | |||
| G1 | 52 (8.1) | 69 (13.5) | 0.003* | 53 (7.8) | 37 (7.3) | 0.646 | 60 (8.8) | 54 (10.5) | 0.587 |
| G2 | 117 (17.2) | 78 (15.3) | 25 (3.7) | 18 (3.5) | 43 (6.3) | 38 (7.5) | |||
| G3 | 30 (4.4) | 12 (2.4) | 2 (0.3) | 0 (0) | 7 (1.1) | 4 (0.8) | |||
The frequency of US detected tenosynovitis at the level of the wrist joint in the study groups is illustrated in Table IV.
Table IV
Ultrasound detected tenosynovitis of the flexor tendons and extensor compartment at the level of the wrist in the studied rheumatoid arthritis and psoriatic arthritis groups
| Variable | RA group (n = 40 hands) [n (%)] | PsA group (n = 30 hands) [n (%)] | p-value |
|---|---|---|---|
| Flexor tendons | |||
| FDS | 8 (20) | 11 (36.7) | 0.121 |
| FDP | 7 (17.5) | 7 (23.3) | 0.546 |
| FPL | 6 (15) | 11 (36.7) | 0.036* |
| FCU | 6 (15) | 3 (10) | 0.536 |
| FCR | 5 (12.5) | 7 (23.3) | 0.234 |
| Total flexor tenosynovitis | 32/200 (16) | 39/150 (26) | 0.021* |
| Extensor compartments | |||
| Compartment 1 | 9 (22.5) | 3 (10) | 0.200 |
| Compartment 2 | 8 (20) | 7 (23.3) | 0.737 |
| Compartment 3 | 7 (17.5) | 5 (16.7) | 0.927 |
| Compartment 4 | 12 (30) | 2 (6.7) | 0.015* |
| Compartment 5 | 9 (22.5) | 3 (10) | 0.170 |
| Compartment 6 | 8 (20) | 4 (13.3) | 0.464 |
| Total extensor compartments | 53/240 (22.1) | 24/180 (13.3) | 0.022* |
In RA and PsA patients, a total of 200 and 150 flexor tendon sheaths and 240 and 180 extensor compartments respectively were examined sonographically at the level of the wrist joint. Compared with RA, PsA patients were more likely to have flexor tenosynovitis, especially at the flexor pollicis longus. Among the wrist extensor tendon compartments, tenosynovitis was more prevalent in RA patients, especially at the extensor digitorum longus.
As shown in Table V, gray scale US findings of synovitis showed significant correlations with SJC, TJC, ESR and disease activity scores while joint erosions had a significant correlation with disease duration in both RA and PsA patients.
Table V
Correlation of ultrasound findings with clinical and laboratory data in the studied rheumatoid arthritis and psoriatic arthritis patients
| Variable | Total synovial hypertrophy score | Total effusion | Total erosion score | Total flexor tenosynovitis | Total extensor tenosynovitis | |||||
|---|---|---|---|---|---|---|---|---|---|---|
| r | p | r | p | r | p | r | P | R | p | |
| Disease duration | ||||||||||
| RA group | 0.195 | 0.41 | 0.017 | 0.943 | 0.508 | 0.022* | 0.153 | 0.521 | 0.384 | 0.095 |
| PsA group | –0.063 | 0.825 | 0.070 | 0.804 | 0.531 | 0.007* | 0.127 | 0.652 | –0.035 | 0.901 |
| Morning stiffness | ||||||||||
| RA group | 0.556 | 0.017* | 0.351 | 0.153 | 0.371 | 0.107 | 0.218 | 0.385 | –0.199 | 0.428 |
| PsA group | 0.410 | 0.211 | 0.327 | 0.327 | 0.399 | 0.224 | 0.223 | 0.509 | 0.214 | 0.527 |
| SJC | ||||||||||
| RA group | 0.683 | < 0.001* | 0.419 | 0.011* | 0.532 | 0.07 | 0.367 | 0.124 | 0.312 | 0.087 |
| PsA group | 0.548 | 0.001* | 0.466 | 0.013* | 0.387 | 0.089 | 0.245 | 0.321 | 0.188 | 0.426 |
| TJC | ||||||||||
| RA group | 0.614 | 0.004* | 0.425 | 0.062 | 0.412 | 0.071 | 0.591 | 0.006* | –0.196 | 0.407 |
| PsA group | 0.592 | 0.02* | 0.557 | 0.031* | 0.259 | 0.351 | 0.127 | 0.653 | 0.123 | 0.663 |
| VAS | ||||||||||
| RA group | 0.377 | 0.101 | 0.315 | 0.177 | 0.637 | 0.121 | 0.332 | 0.153 | 0.351 | 0.022* |
| PsA group | 0.648 | 0.009* | 0.642 | 0.01* | 0.438 | 0.102 | 0.309 | 0.262 | 0.162 | 0.564 |
| ESR | ||||||||||
| RA group | 0.566 | 0.009* | 0.242 | 0.303 | 0.246 | 0.296 | 0.426 | 0.061 | –0.089 | 0.710 |
| PsA group | 0.659 | 0.008* | 0.496 | 0.060 | 0.412 | 0.127 | 0.221 | 0.428 | –0.105 | 0.709 |
| CRP | ||||||||||
| RA group | 0.372 | 0.106 | 0.217 | 0.357 | 0.456 | 0.083 | 0.413 | 0.071 | 0.337 | 0.148 |
| PsA group | 0.726 | 0.002* | 0.549 | 0.034* | 0.409 | 0.130 | 0.339 | 0.217 | 0.107 | 0.704 |
| Activity scores | ||||||||||
| DAS28 (RA group) | 0.563 | 0.01* | 0.328 | 0.158 | 0.513 | 0.21 | 0.474 | 0.035* | –0.177 | 0.455 |
| DAPSA (PsA group) | 0.671 | 0.006* | 0.561 | 0.03* | 0.308 | 0.264 | 0.284 | 0.305 | 0.192 | 0.492 |
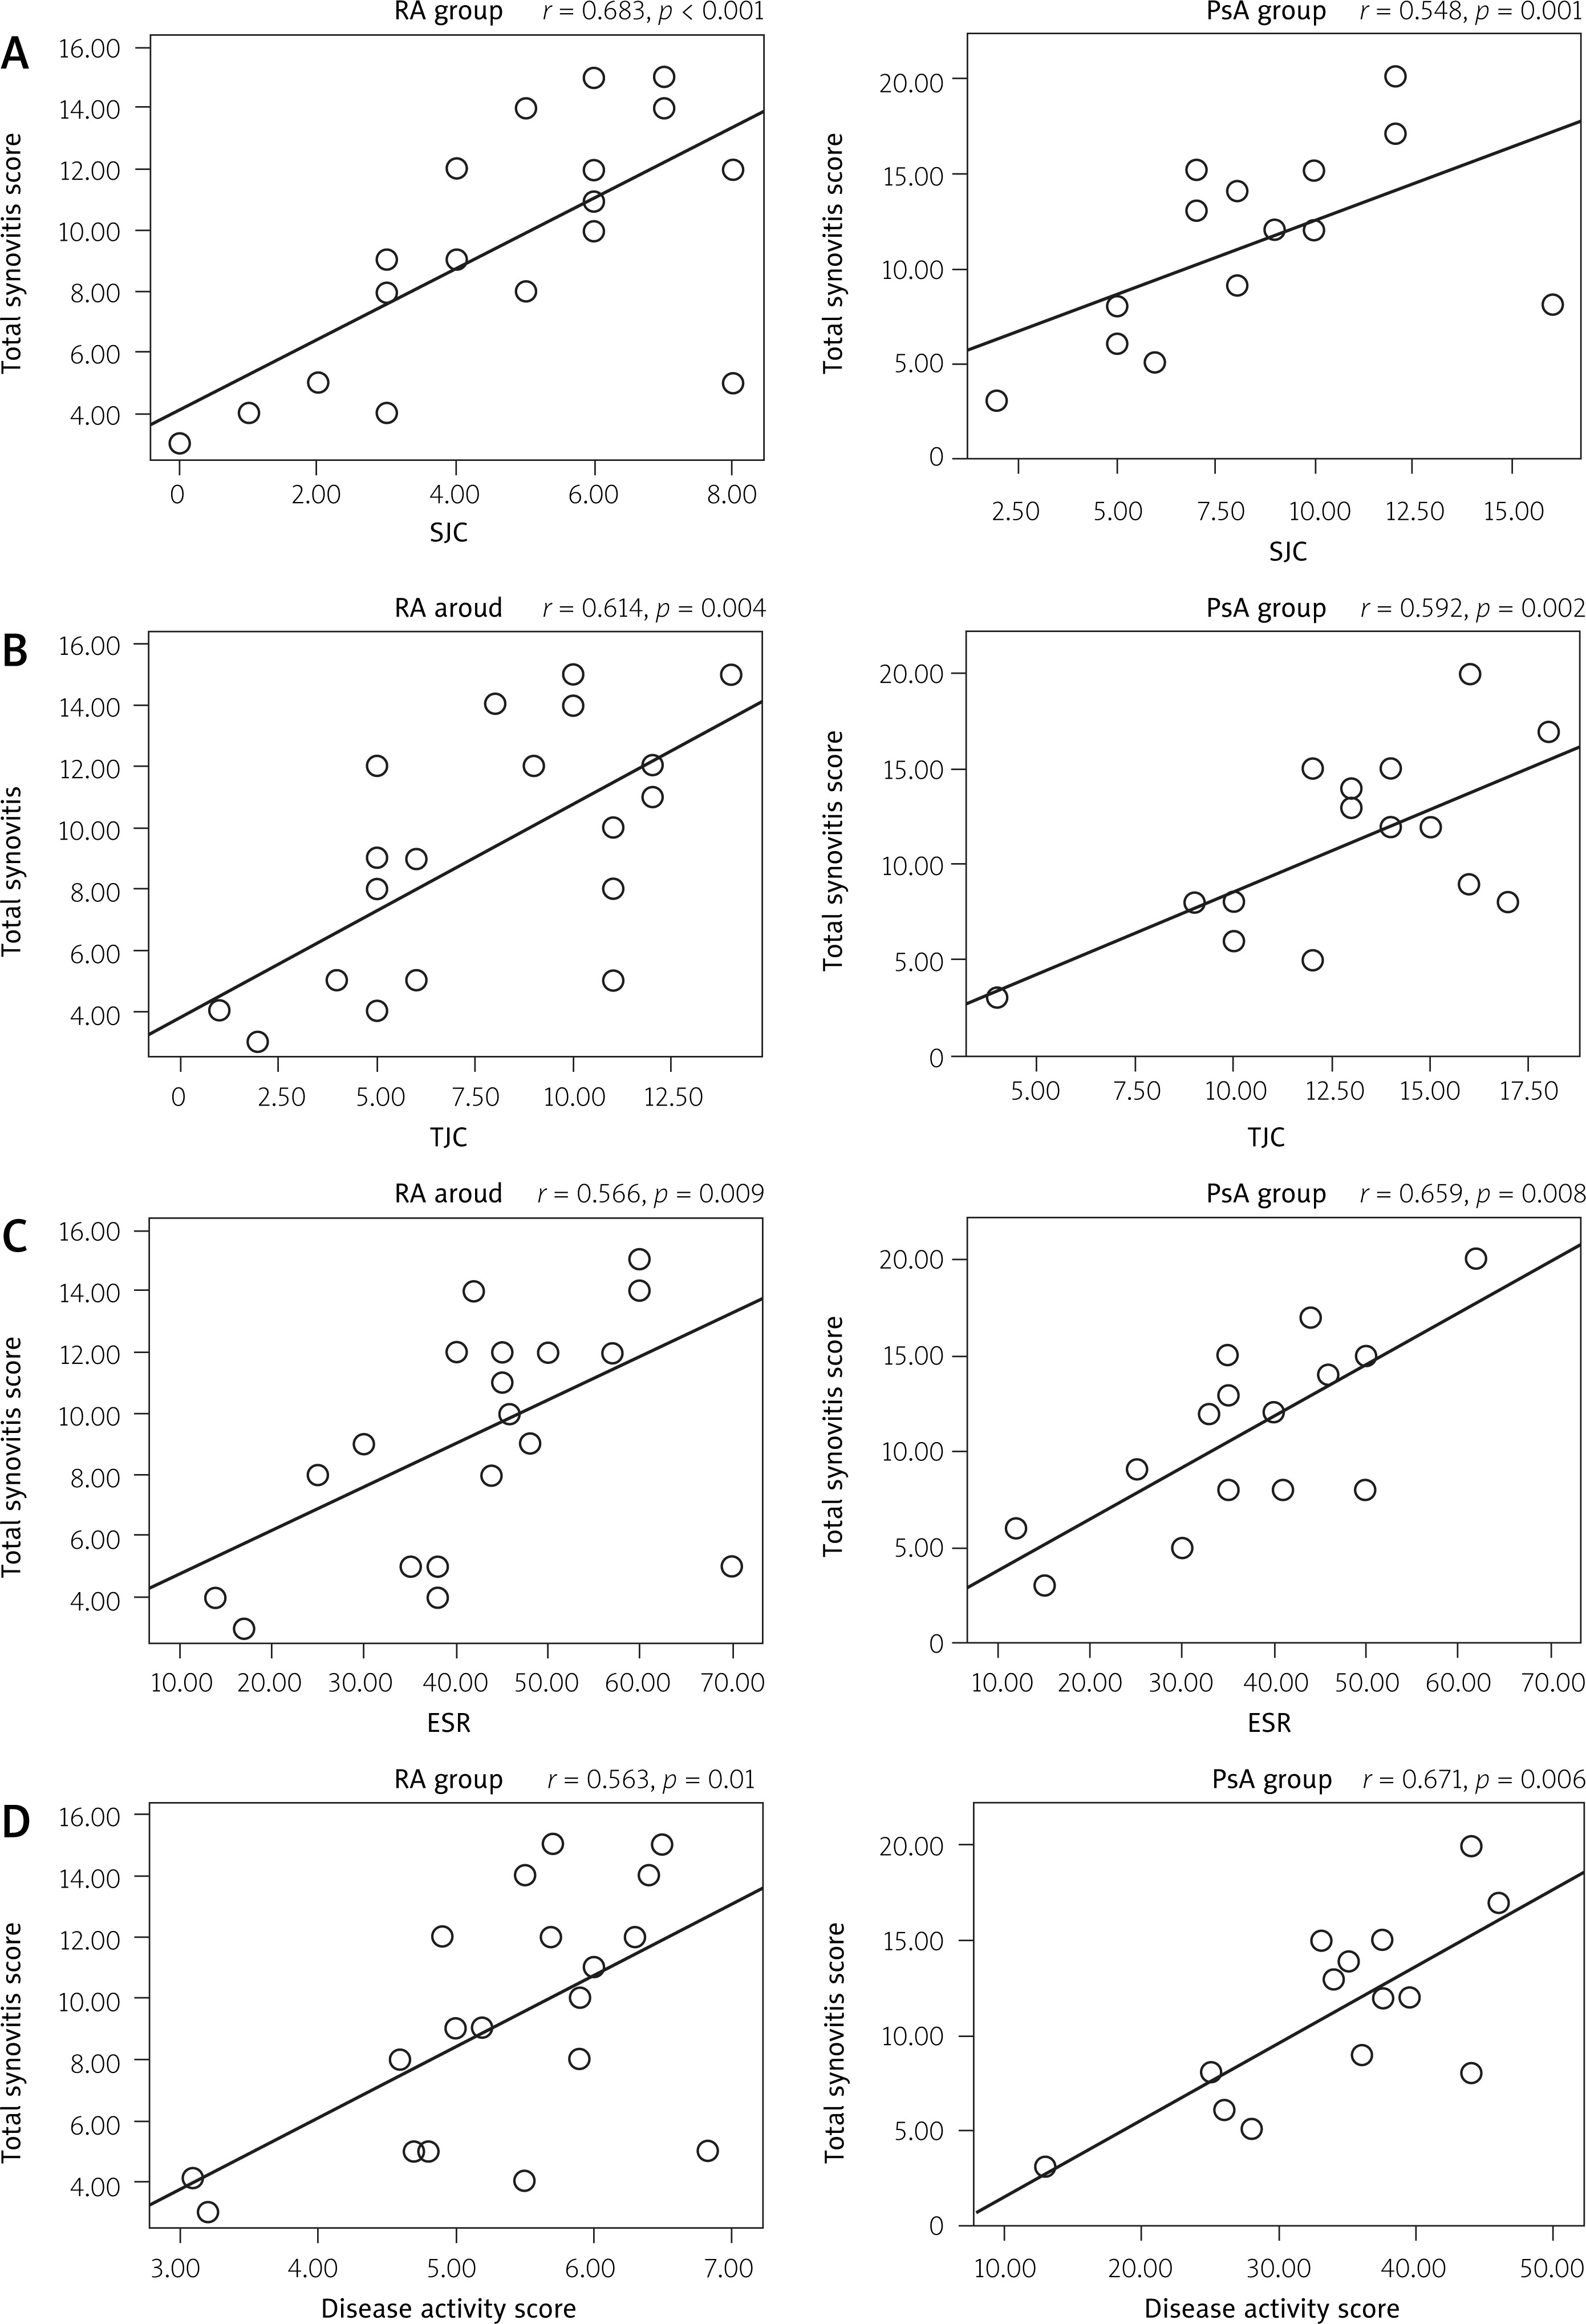
In Figure 1 the correlations between total synovitis score, detected by US and patients’ features in the studied RA and PsA groups are presented.
Fig. 1
Correlation between total synovitis score detected by ultrasonography with patients’ features in the studied rheumatoid arthritis (RA) and psoriatic arthritis (PsA) groups. Total synovitis score positively associated with swollen joint count (A), tender joint count (B), erythrocyte sedimentation rate (C) disease activity scores in both RA and PsA groups (D). Correlation was detected using Pearson’s test. P-value < 0.05 was considered as significant.
ESR – erythrocyte sedimentation rate, PsA – psoriatic arthritis, RA – rheumatoid arthritis, SJC – swollen joint count, TJC – tender joint count.
Discussion
This study examined the capacity of MSUS to differentiate between RA and PsA. We observed significant differences in MSUS findings of the hand and wrist that may help distinguish RA from PsA. We found that joints US features, mainly synovial hypertrophy at the DRUJ, effusion at the RCJ and MCJ, erosions at the RCJ, tenosynovitis at the extensor tendon sheaths in addition to absence of US detected abnormalities at the DIP joints are characteristic for RA and can reliably differentiate it from PsA.
There are a few studies comparing RA with PsA using US. They found that inflammation and edema of the soft tissues are specific for PsA and absent in RA patients [9, 16, 17].
Our results demonstrated that synovial hypertrophy was present both in RA and PsA and it was difficult to distinguish the appearance of synovitis in both diseases. These findings are directly in line with the previous study of Fournié et al. [9], in which US examination was conducted on 25 fingers of RA patients and 25 fingers of PsA patients and erosive synovitis was seen in both groups. Others have shown that US detected synovitis is more frequently present in early RA than in early PsA patients [1].
In this study, the distribution of synovitis was different; while synovitis of DRUJ was frequently observed in RA patients, synovitis at the DIP joints was exclusively detected in PsA patients. A similar pattern of results was noted by Wiell et al. [18], who observed a higher frequency of DIP joint changes in the PsA patients compared with RA patients.
Bone erosions are an important diagnostic feature of inflammatory arthritis that can be identified as an intra-articular discontinuity of the bone surface [15, 19]. Based on results of the present study, we found no significant difference in the prevalence of joint erosions between RA and PsA patients. This is consistent with another ultrasonographic study carried out on 44 RA and 39 PsA patients [16]. However, it is in contrast to the findings of other studies that documented higher prevalence of erosions in RA [18, 20].
Our results demonstrated that the presence of erosions at the RCJ is highly predictive for RA. Zayat et al. [20] presented different data – erosions at the 2nd and 5th MCP joints and distal ulna are highly specific for RA. Additionally, the present study confirmed that erosions at the DIP joints are a distinctive feature of PsA. These findings are directly in line with previous findings of other studies in which erosions were more frequently seen in PIP and DIP joints in PsA patients [21, 22].
Using semiquantitative scoring of US detected abnormalities, RA patients showed more severe forms of synovial hypertrophy, especially at wrist joints (RCJ and MCJ). Overall, these results are in accordance with findings reported in a study from the UK and indicated that the presence of five joints with a gray scale (GS) synovitis score ≥ 2 is a predictor for progression of undifferentiated arthritis to RA [23].
From the results, it is clear that PsA patients are more likely to have flexor tenosynovitis while RA patients are more likely to have extensor tenosynovitis at the level of the wrist joint. A similar conclusion was reached by Tinazzi et al. [24], who found that flexor tenosynovitis of the fingers is more common in PsA than in RA patients. Additionally, Elgendy et al. [25] suggested that tenosynovitis is one of the key features of RA that affect mainly extensor tendons.
Our results cast a new light on the significant correlation between synovitis and SJC, TJC, ESR and disease activity scores in both RA and PsA groups. This is supported by other studies carried out on RA patients that found a correlation between US findings and clinical joint count [21, 26, 27].
In a study conducted on 36 patients with PsA, total synovial score was correlated with the number of swollen joints and not with any other clinical or laboratory measurements of disease activity [28]. In another study conducted on 45 RA patients, there was a significant correlation between US findings and clinical and laboratory parameters [29]. In contrast, some reports in the literature suggest that disease activity does not correlate with the extent of synovitis [30, 31].
In this study, joint erosions had a significant correlation with disease duration in both RA and PsA groups. This is in agreement with the results of other studies carried out on PsA patients [32].
Some limitations of our study should be noted. First, a relatively small sample size was used to compare 2 groups. Second, the difference in treatment modalities between the 2 groups might influence the prevalence of synovial lesions. Third, the mini-entheses were not evaluated. Lastly, power Doppler examination, which would better reflect disease activity, was not performed.
Conclusions
Musculoskeletal US reveals characteristic joint and tendon involvement at the hand and wrist joints that may help to distinguish RA from PsA. The identification of the most commonly affected sites may also facilitate US examination that can be focused on these target sites upon evaluation of RA and PsA patients.
Further studies are encouraged to offer a more detailed characterization and prove whether the findings shown in our study can help differentiate RA and PsA.