
Introduction
Lyme borreliosis (LB) or another name Lyme disease is the most common tick-borne infection in the northern hemisphere and can cause a wide range of symptoms, including fever, headache, fatigue, and rash. While most cases of LB develop without complications, some cases can progress to severe disease that can lead to neurological, cardiac, or joint complications [1, 2]. Early identification of patients at risk can lead to early intervention and improved treatment outcomes [3].
A growing number of theoretical models have been proposed by scientists to better understand the various factors that determine disease risk, which not only enriches our understanding of the ecological cycle of disease transmission, but also contribute to new theoretical developments in model formulation, analysis, and modeling [4, 5].
The aim of this study was to develop a multifactorial model for predicting the severe course and damage to organs and systems in LB in children and to evaluate its effectiveness using receiver operating characteristic (ROC) analysis.
Material and methods
The study involved 122 children, aged 13 ±3 years; 52 males and 70 females patients, residents of the Ternopil region, who visited the Ternopil Regional Children’s Hospital for tick bites during 2017–2022. There were 79 children with confirmed erythema migrans, 16 with arthritis, and 27 with nervous system disorders. All clinical and laboratory data were collected using a Microsoft Excel 16 program and was assessed using multivariate regression analysis.
To build a prognostic model of risk coefficient for the development of the stage of LB (RCDSLB), patients with LB, were examined. Among the 28 factors analyzed, 24 were selected as a most significant risk factors, as well as there were considered significantly affect the development of severe disease.
As the first stage of assessment the 126 children (122 positive of intermediate results) were assessed using Western blot (n = 78).
The study participants answered the questions of a single international questionnaire. Detection of Borrelia burgdorferi in ticks was performed by polymerase chain reaction (PCR) [5, 6]. The conventional two-step diagnostic method screening test (ELISA) and confirmation test (Western blot) was used to detect anti-B. burgdorferi sensu lato immunoglobulin M (IgM) and/or immunoglobulin G (IgG).
Statistical analysis
To check the quality of the prognostic model, the Neigelkirk criterion (R2) was used, and analysis of variance (ANOVA) was used to assess the acceptability of the model. To evaluate the significance of the influence of factor attributes, a stepwise multivariate regression analysis was performed in Statistica 10.0.
Bioethical standards
This study was conducted after approval by the Human Ethics Committee I. Horbachevsky Ternopil National Medical University, of the Ministry of Health of Ukraine (Protocol No. 72 of January 06.2023) in compliance with the basic provisions of the Declaration of Helsinki of the World Medical Association Ethical Principles for Research Involving Human Subjects (1964–2008) and international ethical and scientific standards of good clinical practice.
All patients signed an informed consent for the study. The study was conducted in the laboratory of the Center for the Study of Lyme Borreliosis and Other Tick-Borne Infections.
Results
To develop the model, we conducted a retrospective analysis of clinical and laboratory data from a cohort of pediatric patients diagnosed with Lyme borreliosis were collected (Microsoft Excel 16 program). Then we developed a scoring system based on these factors and evaluated its performance using ROC analysis [7].
In Table I we highlight significant risk factors for diagnostic severe Lyme disease.
Table I
Significant risk factors for severe Lyme disease
After constructing the correlation matrix without taking into account the number of bites (X3), Lipid BB (Borrelia burgdorferi) (X18), P39 (IgG) (X21), and P20 (IgG) (X25), there were no multicollinear factors, as there were no pairwise correlation coefficients greater than 0.7. All of the above 24 factors were used to build a multivariate regression model. The result of obtaining significant factors for predicting the severe course and damage to organs and systems in Lyme borreliosis in children without taking into account is shown in Figure 1.
Based on the results of the multivariate regression analysis of predicting the development of severe Lyme disease, we build a mathematical model to determine the risk factor for the development of disseminated Lyme disease (RFDDSLB):
RFDDSLB = X1*0.195006 + X2*1.054402 + + X4*1.099619 + X5*1.066334 + X6*0.096539 ++ X7*0.119710 + X8*0.808857 + X9*1.359550 + + X10*1.193117 + X11*1.178243 + X12*0.979160 + + X13*0.923724 + X14*1.251910 + X15*1.565490 ++ X16*1.089057 + X17*1.509904 + X19*1.111819 + + X20*0.854634 + X22*0.949557 + X23*1.248157 ++ X24*1.435077 + X26*1.548784 + X27*1.519191 + + X28*0.661533 – 0.76293.
To validate model of predicted risk coefficient for the development of the stage of LB (RCDSLB), we performed a ROC analysis to determine the sensitivity, specificity, and detection rate of localized and disseminated Lyme disease.
Table II shows the initial data for verification of the model of predicted RCDSLB in the classification of risk coefficient for the development of LB localized form (RCDSLBLF), relative to risk coefficient for the development of the stage of LB disseminated form (RCDSLBDF).
Table II
Initial data for verification of the model of predicted RCDSLB in the classification of RCDSLBLF, relative to RCDSLBDF
| RCDSLB | RCDSLBLF | RCDSLBDF | Total |
|---|---|---|---|
| RCDSLBLF | 50 | 1 | 51 |
| True positive (a) | False positive (b) | a + b | |
| RCDSLBDF | 3 | 68 | 71 |
| False negative (c) | True negative (d) | c + d | |
| Total | 53 | 69 | 122 |
| a + b + c + d |
The authors proposed to introduce a coefficient of risk for the development of the stage of LB localized form and disseminated, as RCDSLB, to numerically assess the severity of the condition. The data are presented in Table II.
Based on the data in the Table I we calculate:
Taking into account the numerical values (Table I) and formula (1), we get:
Taking into account the numerical values (Table I) and formula (2), we obtain:
Positive predictive value (PPV) of the result of classification of patients with RCDSLBLF relative to RCDSLBDF:
Taking into account the numerical values (Table I) and formula (3), we obtain:
The probability of detecting patients with RCDSLBLF relative to RCDSLBDF with a positive classification result is 98.04%.
Negative predictive value of the result of classification of patients with RCDSLBLF relative to RCDSLBDF.
Taking into account the numerical values (Table I) and formula (4), we obtain:
The probability of detecting RCDSLBLF patients relative to RCDSLBDF with a negative classification result is 95.77%.
The ratio of the likelihood of a positive result of detecting patients with RCDSLBLF relative to RCDSLBDF
Taking into account the numerical values (Table I) and formula (5), we obtain:
Thus, the likelihood of a positive PRSCLB result in patients with DF is 65,05 times higher compared to the likelihood of a positive result in patients with LF.
Taking into account the numerical values (Table I) and formula (6), we obtain:
So, the probability of getting a negative result (prediction of the risk of the developing of the stage Lyme borreliosis) in patients with LF is 17.39 times higher (1/0.057) compared to the probability of a positive result in patients with disseminated form of LB.
Taking into account the numerical values (Fig. 1), we obtain:
Accuracy RCDSLBLFl,d = [(50 + 68)/(50 + 1 + 3 + 68)] ×× 100% = (118/122) × 100% = 96.72%.
Thus, the share of correct RCDSLBLF forecasting results is 96.72%.
Similarly calculated operating characteristics for verification of the model of predicted RCDSLB in the classification of RCDSLBDF, relative to RCDSLBLF.
Table III shows the general operating characteristics of the RCDSLB model.
Table III
Summarizes the operational characteristics of the RCDSLB model
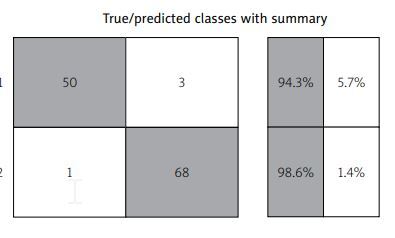
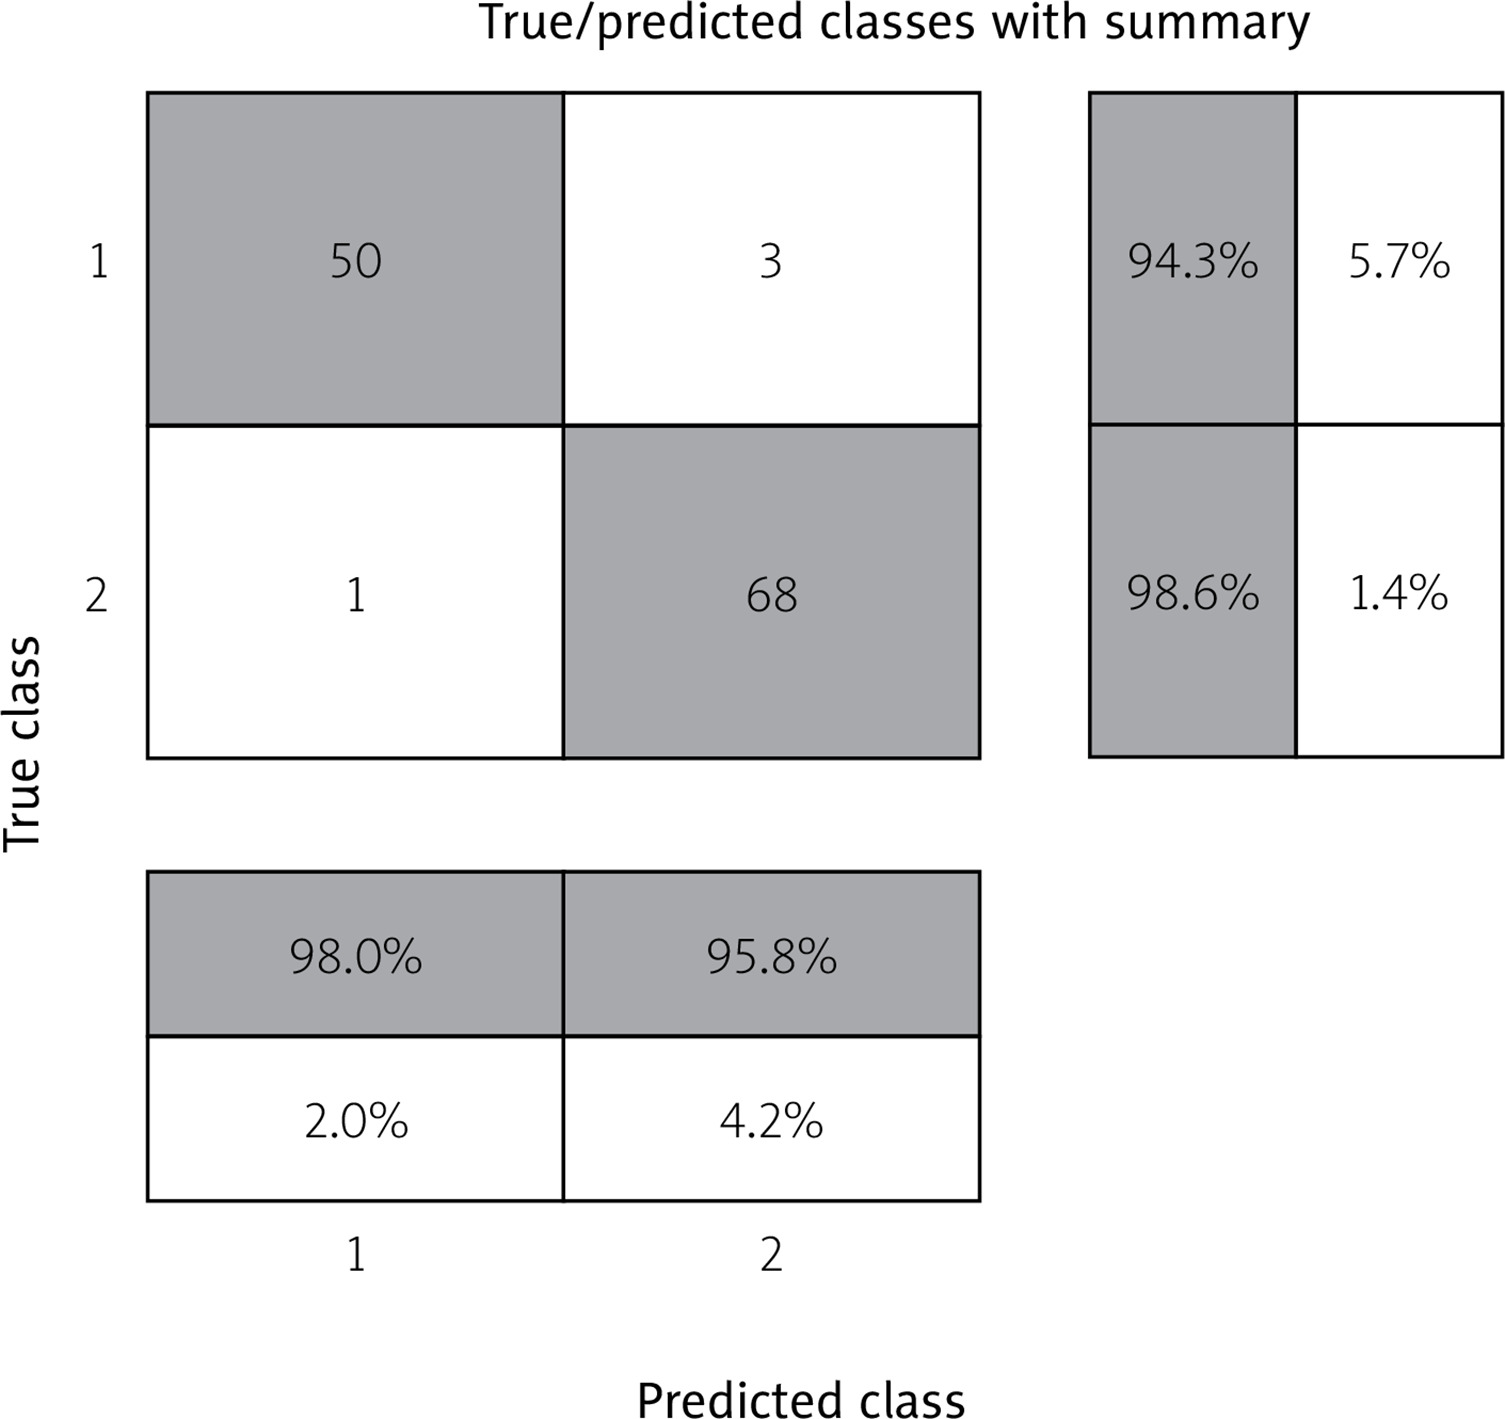
The matrix of inconsistencies in the verification of the RCDSLB model is shown in Figure 1.
Figure 1 shows “true positives” – a column that includes 50 patients in which the model independently predicted a localized stage of LB, which is true, i.e., with a physician-confirmed localized stage of LB.
“True negatives” are the lower right column, which includes 68 patients in whom the model detected disseminated stage of lymphoma, which is true.
The following results were erroneous: 1 patient with confirmed disseminated stage was classified as localized during the calculation; 3 children with confirmed local stage were classified by the model as having disseminated stage of LB.
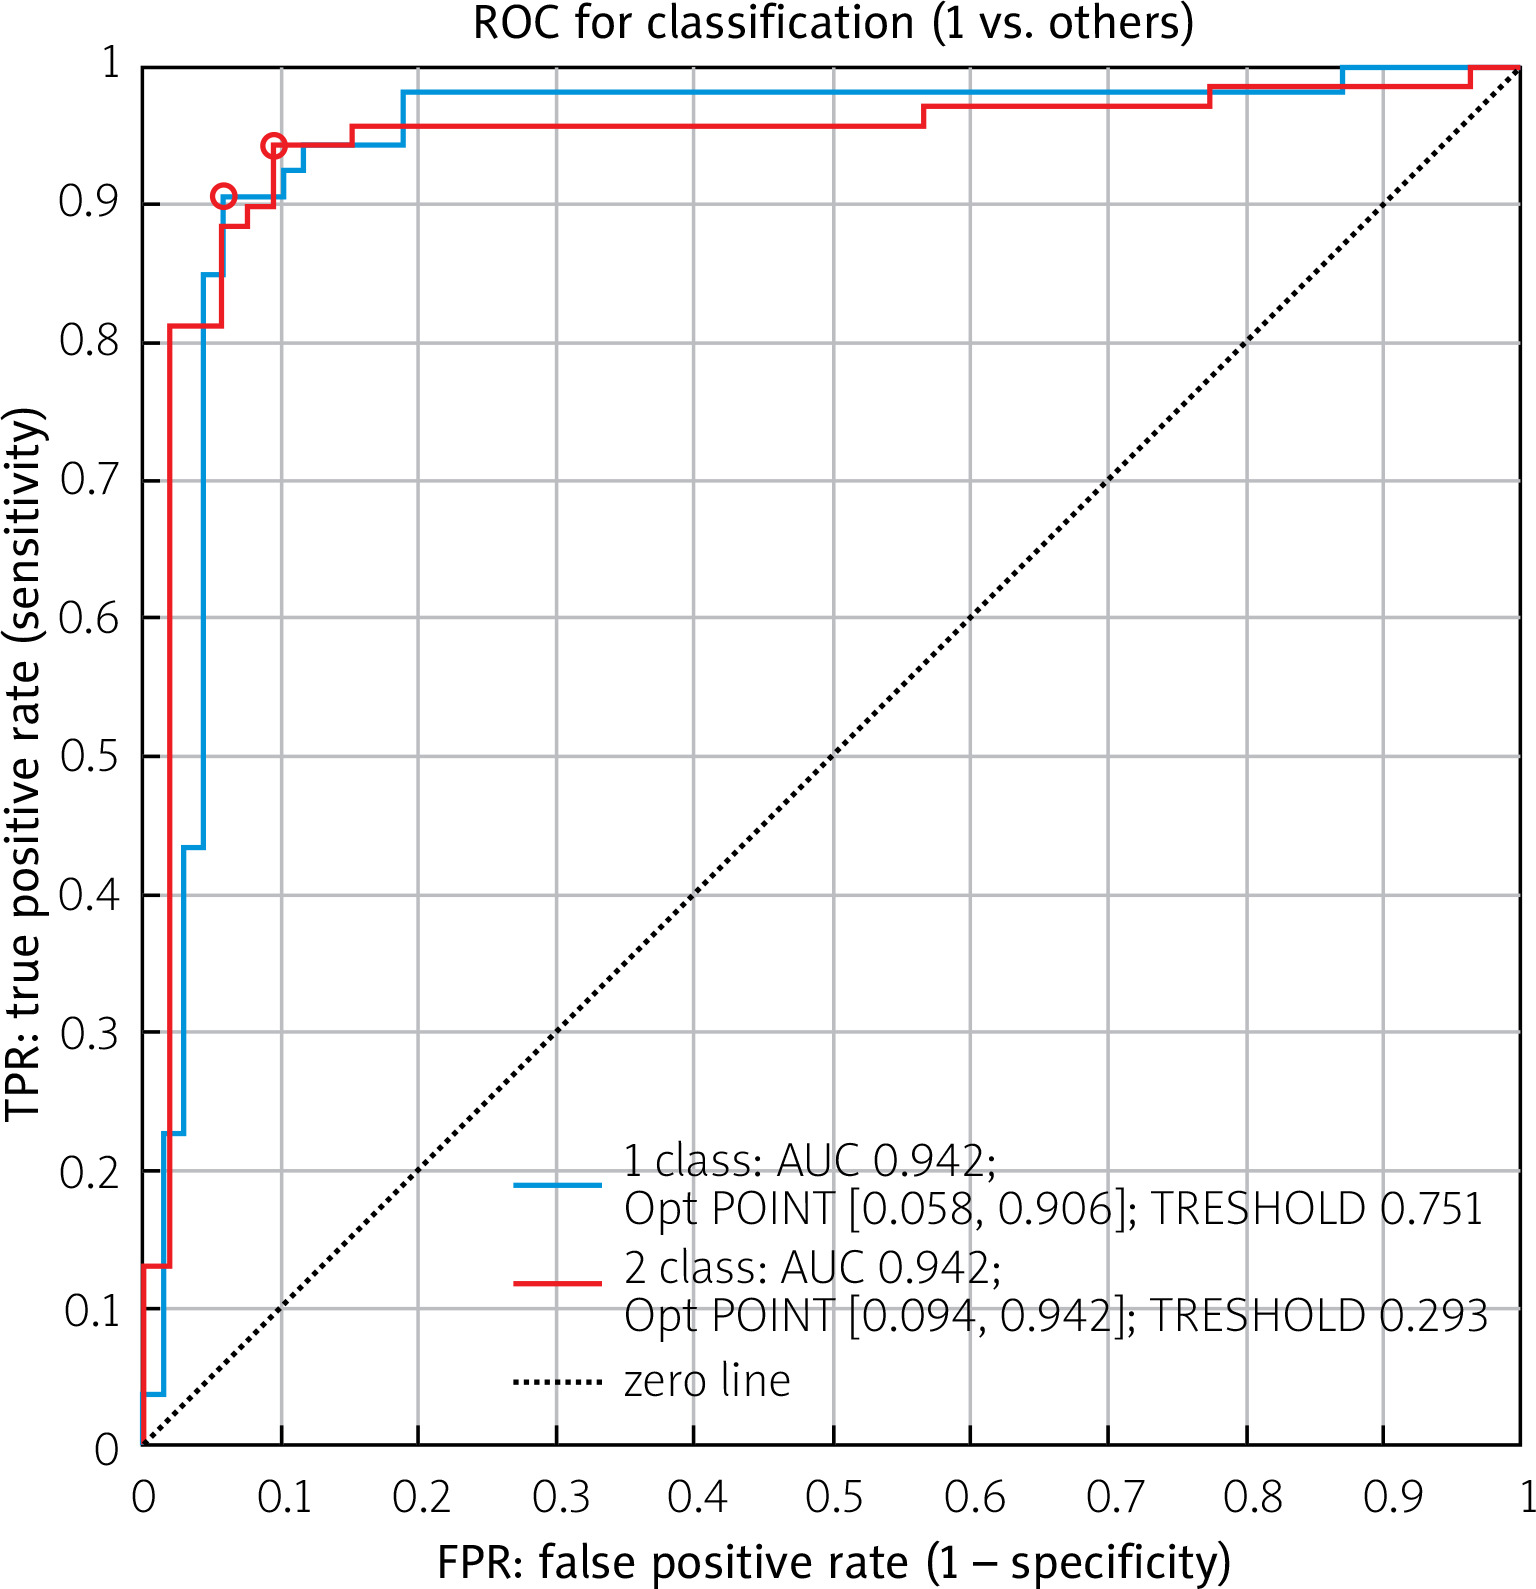
Figure 2 shows the ROC curves of the RCDSLB.
According to Figure 2, we found that the quality of our classification model using RCDSLB. The AUC is 0.942 and indicates an excellent quality of the diagnostic test.
Discussion
A mathematical model was developed to predict the risk of severity of LB in children by the risk factor for disseminated LB in children who had a tick attack. The effectiveness of the formula for predicting the development of the disseminated stage of LB was tested, and a ROC curve was constructed to determine the specificity and sensitivity of our model. Since the process of diagnosis is imperfect – as a result, one can only assume that the diagnosis is correct, and not state it with certainty – modern clinicians increasingly express their confidence in the diagnosis through probabilities [1, 8–10].
Therefore, a doctor should understand the mathematical essence of the diagnostic value (reliability) of tests in different situations. As a rule, this helps the physician to reduce the degree of uncertainty of a particular diagnostic test; in certain cases, to estimate this uncertainty more accurately, and sometimes only to realize the degree of uncertainty in the diagnosis. There are no absolutely accurate diagnostic methods (100%), and doctors often find it difficult to interpret their results. Therefore, it is important to assess the reliability of the diagnostic tests used.
Reliability, validity is a comprehensive characteristic of a methodology (test), including information about the scope of the phenomena under study and the representativeness of the diagnostic procedure in relation to them, and means:
The concept of reliability in biomedicine is multifaceted and includes a set of criteria for evaluating the results of diagnostic tests [4, 5]. The main components of this complex include the following characteristics: sensitivity, specificity, and the predictive value of positive and negative results. Less relevant are the accuracy index and the likelihood ratio of a positive result. Each criterion is a specific statistical indicator [7].
Sensitivity of a test (Sensitivity – Se) is its ability to reliably determine the presence of a given disease in the test subject. Tests with high sensitivity rarely classify as healthy those individuals who actually have any pathology (disease). In other words, sensitive tests should not “miss” patients.
The specificity of a test is its ability to reliably determine the absence of a particular disease in a patient.
Usually, in case of a negative result of a highly specific test, the patient is recognized as healthy. Highly specific tests, as a rule, do not discriminate between healthy and sick people [8].
The sensitivity and specificity of new diagnostic tests are determined by comparing the data on the presence of the disease obtained with the new diagnostic test(s) with the results of a complete clinical examination. The determination of sensitivity and specificity involves the adoption of a reference point – a “gold standard”.
The trade-off between sensitivity and specificity
It is desirable for a diagnostic test to be both highly sensitive and highly specific. However, this is rarely the case in practice. To achieve a compromise between sensitivity and specificity, in order to adequately select a diagnostic criterion to distinguish patients from healthy ones, it is recommended to build a ROC curve based on all possible combinations of sensitivity and specificity values.
The ROC curve is also known as the error curve, and the analysis using it is called ROC analysis. The ROC curve is a characteristic curve that shows the dependence of the number of correctly diagnosed positive cases on the number of incorrectly diagnosed negative cases when varying the threshold of the decisive rule: Y axis = sensitivity, X axis = 1 – specificity
The detection of IgM antibodies against various specific Borrelia antigens, in the absence of antibodies to OspC, is not considered a sufficient indication of recent infection.
Immunoglobulin M antibodies to flagellin (P41) may represent the primary response to B. burgdorferi infection. Nevertheless, a nonspecific reaction cannot be excluded, as antibodies to other antigens are known to react cross-reacting with B. burgdorferi with flagellin (P41).
Therefore, a single band corresponding to the flagellin position (P41) in the IgM assay should not be considered as confirmation of a fresh infection with B. burgdorferi infection. If only one P41 band is stained on the strip, the test should be repeated on a fresh specimen taken several weeks later. In serologic studies of borreliosis, the determination of antibodies of the IgM class of immunoglobulins often gives unclear results [9].
Immunoglobulin M antibodies are detected years after infection or after antibiotic therapy. Therefore, the presence of specific antibodies of the immunoglobulin class does not necessarily indicate a recent infection. At the same time, a negative IgM antibody result does not exclude the presence of a fresh infection [10].
At the late stage of borreliosis, a positive IgM antibody result does not provide any additional information. The reason for these false positives is often unclear [11].
Immunoglobulin M antibodies are often false-positive and can sometimes be detected for many years after a history of borreliosis (treated or untreated). Therefore, the detection of these antibodies does not necessarily indicate a fresh infection. At the same time, the absence of anti-borreliosis IgM does not exclude a recent infection, as there are cases of detection of specific class of G immunoglobulins without the synthesis of corresponding IgM. To avoid this problem, VlsE is identified in the immunoblotting reaction, which can be considered as the main antigen for the serological diagnosis of borreliosis. More than 85% of IgG-positive sera can be identified by VlsE alone. This antigen is specific for all Borrelia species. The risk of a false-positive reaction is virtually eliminated [12].
In addition, according to the recommendations of the Second National Conference on the Serologic Diagnosis of Lyme Disease [16], the detection of IgM in a blot analysis can be considered only when at least 2 of the following 3 antigens are present 24 kDa (OspC), 39 kDa (BmpA) and 41 kDa (Fla). This may indicate either a recent infection with B. afzelii or a residual IgM titer, which, as mentioned earlier, can sometimes be detected for many years [13, 14]. Statistical methods for identifying and predicting various pathologies are becoming more common in scientific discussions [15–19].
A number of scientific papers have considered regression models for predicting the severity of the disease. For example, the factors of predicting the risk of hypothyroidism in type 2 diabetes mellitus (T2DM) have been studied. An algorithm for predicting the risk of developing hypothyroidism in patients with T2DM has been developed. In accordance with the mathematical model obtained by regression analysis, the algorithm is used to timely implement appropriate preventive measures among patients with T2DM [20].
An algorithm for predicting the risk of developing diffuse non-toxic goiter in patients with T2DM using a mathematical model obtained by regression analysis was developed for the timely implementation of appropriate preventive measures among patients with T2DM [21]. A prognostic model of the risk of developing diffuse non-toxic goiter in patients with T2DM was built using multiple regression analysis.
Regression analysis was used to determine the most significant multicollinear risk factors for the development of CR: thyroid pathology, smoking, alcohol consumption, adverse environmental conditions, low physical activity, stress and anxiety in history [22].
Our results show that the multifactorial model we developed has good predictive performance, with an area under the ROC curve of 0,942. This suggests that the model can be a useful tool for physicians in identifying patients at risk of developing severe LB and in making treatment decisions [23, 24].
Study limitations
The studies concerned patients from one geographical area. However, it can be assumed that the data and course of the disease should not be different from other regions.
Conclusions
This study proves the effectiveness of a multifactorial model for predicting severe course and organ and system damage in LB in children. The model has the potential to improve patient outcomes by providing early identification of those at risk of severe disease and requiring early intervention. The results obtained can be used to improve the prognosis and diagnosis of severe disease and organ and systemic damage in LB in children, as well as to develop more effective and personalized approaches to the treatment of this disease. As a final conclusion, we note that:
the results of the study showed that the multifactorial model predicts the severity of organ and system damage in LB in children with an accuracy of 95%,
the ROC curve, which was built on the basis of the result of investigation has an area under the curve of 0.94, which indicates the high efficiency of the model,
the sensitivity and specificity of the diagnostic test, positive and negative predictive value, ratio of the likelihood of a positive and negative result can be examined using risk coefficient for the development of the stage of Lyme borreliosis disseminated form (RCDSLBDF),
the results of our study provide an opportunity for further development of standardized scales of the severity of LB and possible damage to organs and systems.