Introduction
Ankylosing spondylitis (AS) is an inflammatory autoimmune disease mainly affecting the sacroiliac joints and spine, which leads to a decrease in the quality of life, chronic pain, and consequently disability [1]. Ankylosing spondylitis is the most common disease among seronegative spondyloarthropathies and is associated with human leukocyte antigen B27 positivity in most cases. Men are more prone to this disease than women. Ankylosing spondylitis typically starts in the second decade of life and rarely occurs after the age of 45. The first symptoms are pain in the lower back and morning stiffness of the spine. The pathogenesis of the disease is not fully known, but the triggers of inflammation are recognized. It is hypothesized that in genetically predisposed individuals, exposure to bacterial or environmental antigens may trigger an immune response. This can lead to increased production of pro-inflammatory cytokines, including interleukin-12, interleukin-17 (IL-17), and tumor necrosis factor (TNF) [2]. Following the diagnosis of AS, patient education and multidisciplinary care are essential. The cornerstone of treatment is physiotherapy and exercise-based rehabilitation. The first line of pharmacotherapy in AS is nonsteroidal anti-inflammatory drugs, which can be used at the maximum tolerated dose, taking both benefits and risks into consideration. The second line of treatment is TNF inhibitors (anti-TNFs), IL-17 inhibitors (IL-17i), or Janus kinase inhibitors [3]. They are shown to be effective in reducing inflammation and disease activity in AS [4, 5]. In this study, we investigated the TNF inhibitor adalimumab (ADA), which is the first fully human monoclonal antibody directed against TNF. Adalimumab is well known for reducing the inflammatory markers C-reactive protein (CRP) and erythrocyte sedimentation rate (ESR) [6, 7]. To initiate, continue, or discontinue therapy, disease activity should be monitored regularly. It can be assessed with CRP, ESR, and the Bath Ankylosing Spondylitis Disease Activity Index (BASDAI) scale. The neutrophil–lymphocyte ratio (NLR), platelet–lymphocyte ratio (PLR), and monocyte–lymphocyte ratio (MLR) are hematological markers, which correlate with CRP and ESR values, currently being investigated by researchers to determine the severity of inflammation [8]. Data show NLR, MLR, and PLR are higher in patients with AS than in healthy controls [1, 9, 10]. The NLR, PLR, and MLR indexes are well-known predictive indicators in infectious and inflammatory diseases; however, optimal cut-off values have not yet been established [11–13]. There are no universally accepted thresholds for these hematological markers, as they are likely influenced by disease type and individual patient-related factors [14–16].
The aim of this study was to investigate the response to treatment with ADA in patients with AS using hematological markers such as NLR, PLR, and MLR during one-year treatment and assess the correlation with other inflammatory markers.
Material and methods
A retrospective analysis of the medical history of 28 patients (4 women and 24 men) with confirmed AS who were under constant, long-term care of a clinical rheumatology department was conducted. The study included patients treated between January 2018 and March 2023. Diagnosis of AS was based on Assessment of SpondyloArthritis International Society 2010 criteria. All of the patients were newly initiated on ADA therapy, and it was their first biological treatment. Patients who had received prior biologic therapy other than ADA or who discontinued ADA within 12 months were excluded. In addition, patients older than 70 years were not included in the study. We assessed full blood count for each patient. Neutrophil–lymphocyte ratio was calculated by dividing the neutrophil count by the lymphocyte count, PLR was calculated by dividing the platelet count by the lymphocyte count, and MLR was calculated by dividing the monocyte count by the lymphocyte count. The inflammatory markers (NLR, PLR, MLR, CRP, ESR) and BASDAI scale were assessed at the beginning of the observation (month 0) and after 3, 6, and 12 months of ADA therapy for every patient. The results were analyzed using the Wilcoxon signed-rank test and Spearman’s rank correlation coefficient.
Bioethical standards
The study was conducted in accordance with the Declaration of Helsinki, and the protocol was approved by the Ethics Committee of Medical University of Lublin, Poland (number: KE-0254/123/04/2023 on 27th April 2023). Due to the retrospective and anonymized nature of the study, the requirement for written informed consent from individual patients was waived by the Ethics Committee. All patient data were handled confidentially and anonymized prior to analysis.
Results
A total of 28 patients (median age was 37 years; range: 26–56) were included. The majority of patients were male (85.71%). Median disease duration at the moment of starting ADA treatment was 7 years (range: 2–28).
The median NLR value after 3 months of treatment was 1.48 (95% confidence interval, CI: 0.92–2.03; p < 0.001), after 6 months 1.48 (95% CI: 0.92–2.12; p < 0.001), and after 12 months 1.67 (95% CI: 1.08–2.30; p < 0.001). All differences compared to baseline were statistically significant. Differences between months 3 and 6 (median difference 0.07; 95% CI: from –0.33 to 0.44; p = 1.000), between months 3 and 12 (0.17; 95% CI: from –0.16 to 0.57; p = 0.774), and between months 6 and 12 (0.08; 95% CI: from –0.21 to 0.40; p = 1.000) were not statistically significant (Tables I and II).
Table I
Summary statistics of key biomarkers and disease activity scores at baseline and during therapy follow-up
[i] All values are reported as median (first quartile, third quartile), followed by 95% confidence interval (CI) (lower limit, upper limit) for the median, and range [minimum, maximum]. Time points refer to baseline (prior to therapy initiation) and follow-up assessments at 3, 6, and 12 months of therapy.
Table II
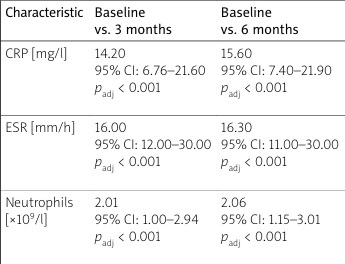
Pairwise comparisons of median differences in key biomarkers and disease activity scores between time points
The median MLR value after 3 months of treatment was 0.07 (95% CI: 0.03–0.13; p = 0.005), after 6 months 0.05 (95% CI: 0.00–0.11; p = 0.101), and after 12 months 0.06 (95% CI: 0.01–0.11; p = 0.047). Statistically significant differences were observed after 3 and 12 months, but not after 6 months (Tables I and II).
The median PLR value after 3 months of treatment was 52.8 (95% CI: 30.1–79.6; p < 0.001), after 6 months 65.5 (95% CI: 31.6–83.9; p < 0.001), and after 12 months 68.8 (95% CI: 42.7–93.7; p < 0.001). All changes compared to baseline were statistically significant (Table I).
At baseline, PLR showed a strong negative correlation with lymphocyte count (ρ = –0.83; 95% CI: from –0.92 to –0.65; p < 0.001), and a strong positive correlation was observed between CRP and ESR (ρ = 0.77; 95% CI: 0.56–0.89; p < 0.001; Table III).
Table III
Significant Spearman correlations between biomarkers at baseline and follow-up time points
[i] Correlations are reported as Spearman’s rank correlation coefficient (Rho) with 95% confidence intervals (CI) and adjusted p-values (padj) using the Holm-Bonferroni method for multiple comparisons. Only significant correlations (padj < 0.05) are included.
After 3 months of ADA therapy, PLR remained strongly and inversely correlated with lymphocytes (ρ = –0.92; 95% CI: from –0.96 to –0.82; p < 0.001). In addition, significant positive correlations were found between CRP and neutrophil count (ρ = 0.63; 95% CI: 0.31–0.82; p = 0.014) and between neutrophils and monocytes (ρ = 0.63; 95% CI: 0.32–0.82; p = 0.014; Table III).
At 6 and 12 months, the inverse relationship between PLR and lymphocyte count persisted (ρ = –0.88 and –0.87, respectively; both p < 0.001), indicating a stable negative association throughout the treatment period. No other statistically significant correlations were observed (Table III).
There was no correlation between NLR, PLR, and MLR and BASDAI score.
Discussion
The search for more reliable inflammatory markers in rheumatic diseases is ongoing. Although CRP and ESR are traditionally used, hematological markers may also be useful, particularly due to their lower cost and in patients with persistently low CRP or ESR levels despite ongoing inflammation [17, 18].
Hematological marker values decrease over the course of ADA treatment in patients with AS [8]. This suggests an association with disease activity, which also decreases during therapy.
In our calculations NLR value is correlating with CRP and ESR values, as other studies are indicating [8, 19–22]. And it probably makes it alternative biomarker, when it is impossible to use CRP or ESR for AS. We need further studies to confirm this hypothesis. In our study MLR and PLR were not correlating with CRP and ESR values, which suggests they might be not good indicators of inflammation, but research show divergencies [17, 19, 20, 23], we probably need larger group of patients to observe more correlations and comparison with other anti-TNFs.
In our study, hematological markers did not correlate with the BASDAI score, which is a fully subjective patient-reported measure. A limitation of this score is its susceptibility to inter-individual variability in perceived well-being. In contrast to our findings, some studies have reported that NLR correlated with the BASDAI score [8, 17, 24, 25]. According to current recommendations, the ASDAS score is considered more reliable for assessing AS disease activity and may correlate with hematological markers, which warrants further investigation [3, 26, 27].
Neutrophil–lymphocyte ratio value is easy to calculate and inexpensive test, which makes it useful marker to assess disease activity. Peripheral blood testing is a widely used diagnostic approach worldwide and may be a useful tool for assessing inflammation. Neutrophil–lymphocyte ratio is a rapidly responsive biomarker characterized by high sensitivity and low specificity, which may complicate interpretation in the presence of other inflammatory conditions such as infectious diseases or malignancy [28]. In our study, these conditions were more easily excluded, as all patients underwent a full diagnostic evaluation for comorbid diseases associated with elevated inflammatory markers prior to initiation of biological therapy.
The PLR value has several limitations in research. In patients with rheumatic diseases, the PLR may be inaccurately estimated due to the use of glucocorticosteroids, analgesics, and antirheumatic drugs, which can affect blood cell counts – a factor that was not considered in our study. Moreover, studies lasting longer than 6 months should consider potential seasonal variability of hematologic indices [29].
A recent study by Sadioglu et al. [30] analyzed hematologic inflammatory markers in 54 biologic-naive AS patients treated with biologic agents and observed a significant decrease in NLR, PLR, and MLR after 12 months of therapy, compared with baseline values, with no significant differences between the 3-, 6-, and 12-month follow-ups. Importantly, the authors did not find correlations between these indices and BASDAI, although they observed associations with traditional inflammatory markers such as CRP and ESR. Our results are largely consistent with these findings, confirming that NLR, PLR, and MLR significantly decreased during 12 months of ADA treatment. However, our study adds a new aspect to the existing evidence. It focuses exclusively on patients who initiated ADA as their first biologic therapy, which allows clearer attribution of hematologic changes to the effect of this specific TNF inhibitor [30].
In our study, a strong negative correlation between PLR and lymphocyte count was observed at baseline and persisted throughout all follow-up points. This means that higher PLR values were consistently associated with lower lymphocyte counts, reflecting ongoing systemic inflammation despite clinical improvement. The stability of this correlation over 12 months suggests that PLR may serve as a reliable indicator of immune response during therapy with ADA.
Similar findings showed that PLR was inversely related to lymphocyte count and disease activity in AS [12, 20]. In contrast, the temporary correlations between neutrophils, monocytes, and CRP observed after 3 months probably reflected an early inflammatory response that normalized with treatment.
An important advantage of hematological markers is that they are fast-responding markers. According to many research papers [15, 29], they change faster than other inflammatory markers such as CRP and ESR. This may allow them to better reflect real-time disease activity. According to the latest scientific reports, hematological markers are promising indicators of inflammation and correlate with the activity of many other rheumatic diseases [31–34].
Conclusions
In our study, the most prominent hematological marker was NLR, which may be a useful indicator of inflammation in patients with AS and could serve as an adjunct to ESR and CRP. Other biomarkers, such as MLR and PLR, require further investigation in relation to AS disease activity, in view of the inconsistent research results. Our data show BASDAI did not correlate with disease activity markers, including the most commonly used markers, ESR and CRP. This may limit its usefulness in research and in assessing response to ADA therapy.
Peripheral blood testing is easy and inexpensive to perform worldwide, making hematological markers worthy of further investigation in inflammatory diseases. However, further research on a large cohort of patients is required to determine their utility as inflammatory markers in AS.