
Introduction
Considered to be the most common joint disease worldwide, osteoarthritis (OA) affects 50% or more of the elderly population and is present in about 10% of the knees of women aged over 60 years [1–5]. Osteoarthritis is a major cause of pain and disability to patients [1–5].
Imaging examinations such as X-ray, computed tomography and magnetic resonance may provide information about the articular structure [6]. Other evaluations are useful to evaluate disability, including specific questionnaires such as the Western Ontario and McMaster Universities Osteoarthritis Index (WOMAC) [7]. Imaging modalities such as scintigraphy and magnetic resonance allow functional physiological information. Thermography is within this functional imaging category [6]. It is an examination that assesses skin surface temperature through infrared radiation, the most efficient method for the study of cutaneous temperature distribution [8–11]. The use of this technique is interesting for being completely painless, fast and non-invasive, besides having no contraindications or side effects.
Cutaneous temperature is a significant indicator of physiological dysfunctions, since temperature is an indicator of health status [9–11].
As thermography allows the mapping of possible areas of ischemic tissue or with increased temperature [12] it is recommended that it be used in the investigation of OA [11–13].
The study by Varjú et al. [14] found that cutaneous temperature of the joints varied with the severity of OA. Affected joints were warmer than usual at the beginning of the course of OA. As the disease progressed and symptoms worsened, surface temperature of the joints seemed to decrease, but this study was conducted in individuals with OA in the hand and fingers. Other studies have already shown a good correlation between the increase in temperature and important radiographic changes in individuals with knee OA [6, 15].
Regarding the association between pain and cutaneous temperature, a study observed an association between myofascial trigger points of masticatory muscles with algometry and thermography, and verified a positive and moderate correlation. The authors verified that the higher the applied force was, the higher was the local temperature [16].
Knee temperature does not appear to be a predictor of pain in the knees of elderly individuals. However, the author of this study evaluated pain by questionnaires (Knee Pain Scale and WOMAC pain subscale) [17]. As the mechanisms of pain in OA are still not fully established and understood [3, 4], precise methods such as thermography and the objective evaluation of pain through pressure pain thresholds (a technique already employed by previous studies) [18, 19] can bring information about the relationship between pain and cutaneous temperature in this disease. Although thermography is a reliable diagnostic tool to detect quantifiable cutaneous temperature patterns in patients with OA [18], a recent study highlights the fact that current scientific literature is still scarce about the employment of this technique in OA [19].
Therefore, the aim of this study was to evaluate cutaneous temperature of the lower limbs, and to verify its association with pressure pain thresholds in individuals with knee osteoarthritis.
Material and methods
This case series study was conducted at the Institute of Physical Medicine and Rehabilitation (IMREA, in its Portuguese acronym) of the Clinicas Hospital of the University of São Paulo. Volunteers gave written informed consent to participate in this study, which was approved by the local Research Ethics Committee, protocol number 1.455.745.
Individuals of both genders aged 48–77 years with unilateral knee OA were recruited to participate in the study. At the time of data collection, they were being treated at IMREA.
Persons with severe cognitive disorders that prevented the understanding of the study procedures, those who presented fever due to any infection, and those with a history of vascular abnormalities or knee arthroplasty were excluded from the sample.
Volunteers underwent an anamnesis including age, weight, height, affected knee, disease duration, physical disability measured by the WOMAC questionnaire [7], and pain intensity measured by the visual analog scale (VAS) [20]. Before further evaluations, volunteers were instructed not to consume alcohol, caffeine or tobacco, not to use any type of cream or moisturizer, and not to perform strenuous physical activity in the 24 hours that preceded data collection. Once these requirements were met, on the day of the evaluation each volunteer was instructed to wear clothing that would allow the exposure of the lower limbs, so that they could be brought into thermal equilibrium with the temperature of the examination room (21.3 ±0.4°C, humidity of 63.4 ±2.7%).
Subjects remained standing 2 meters away from the infrared sensor, and 0.4 m from the wall. Thermal images were captured by FLIR T650SC infrared sensor, with thermal sensitivity of 0.03°C, resolution of 640 × 480 pixels, image frequency of 30 Hz, spatial resolution of 0.69 mrad, temperature range verification of –40°C to 2000°C, and accuracy of 1°C or ±1% of reading (limited temperature range). Images were taken assuming the emissivity of the skin of 0.98. Subjects were instructed not to perform arm or leg movements, or to scratch any region of the body before or during the procedure. The procedure of evaluation of cutaneous temperature obtained by thermography followed the criteria adopted and recommended by the literature [11, 13, 21].
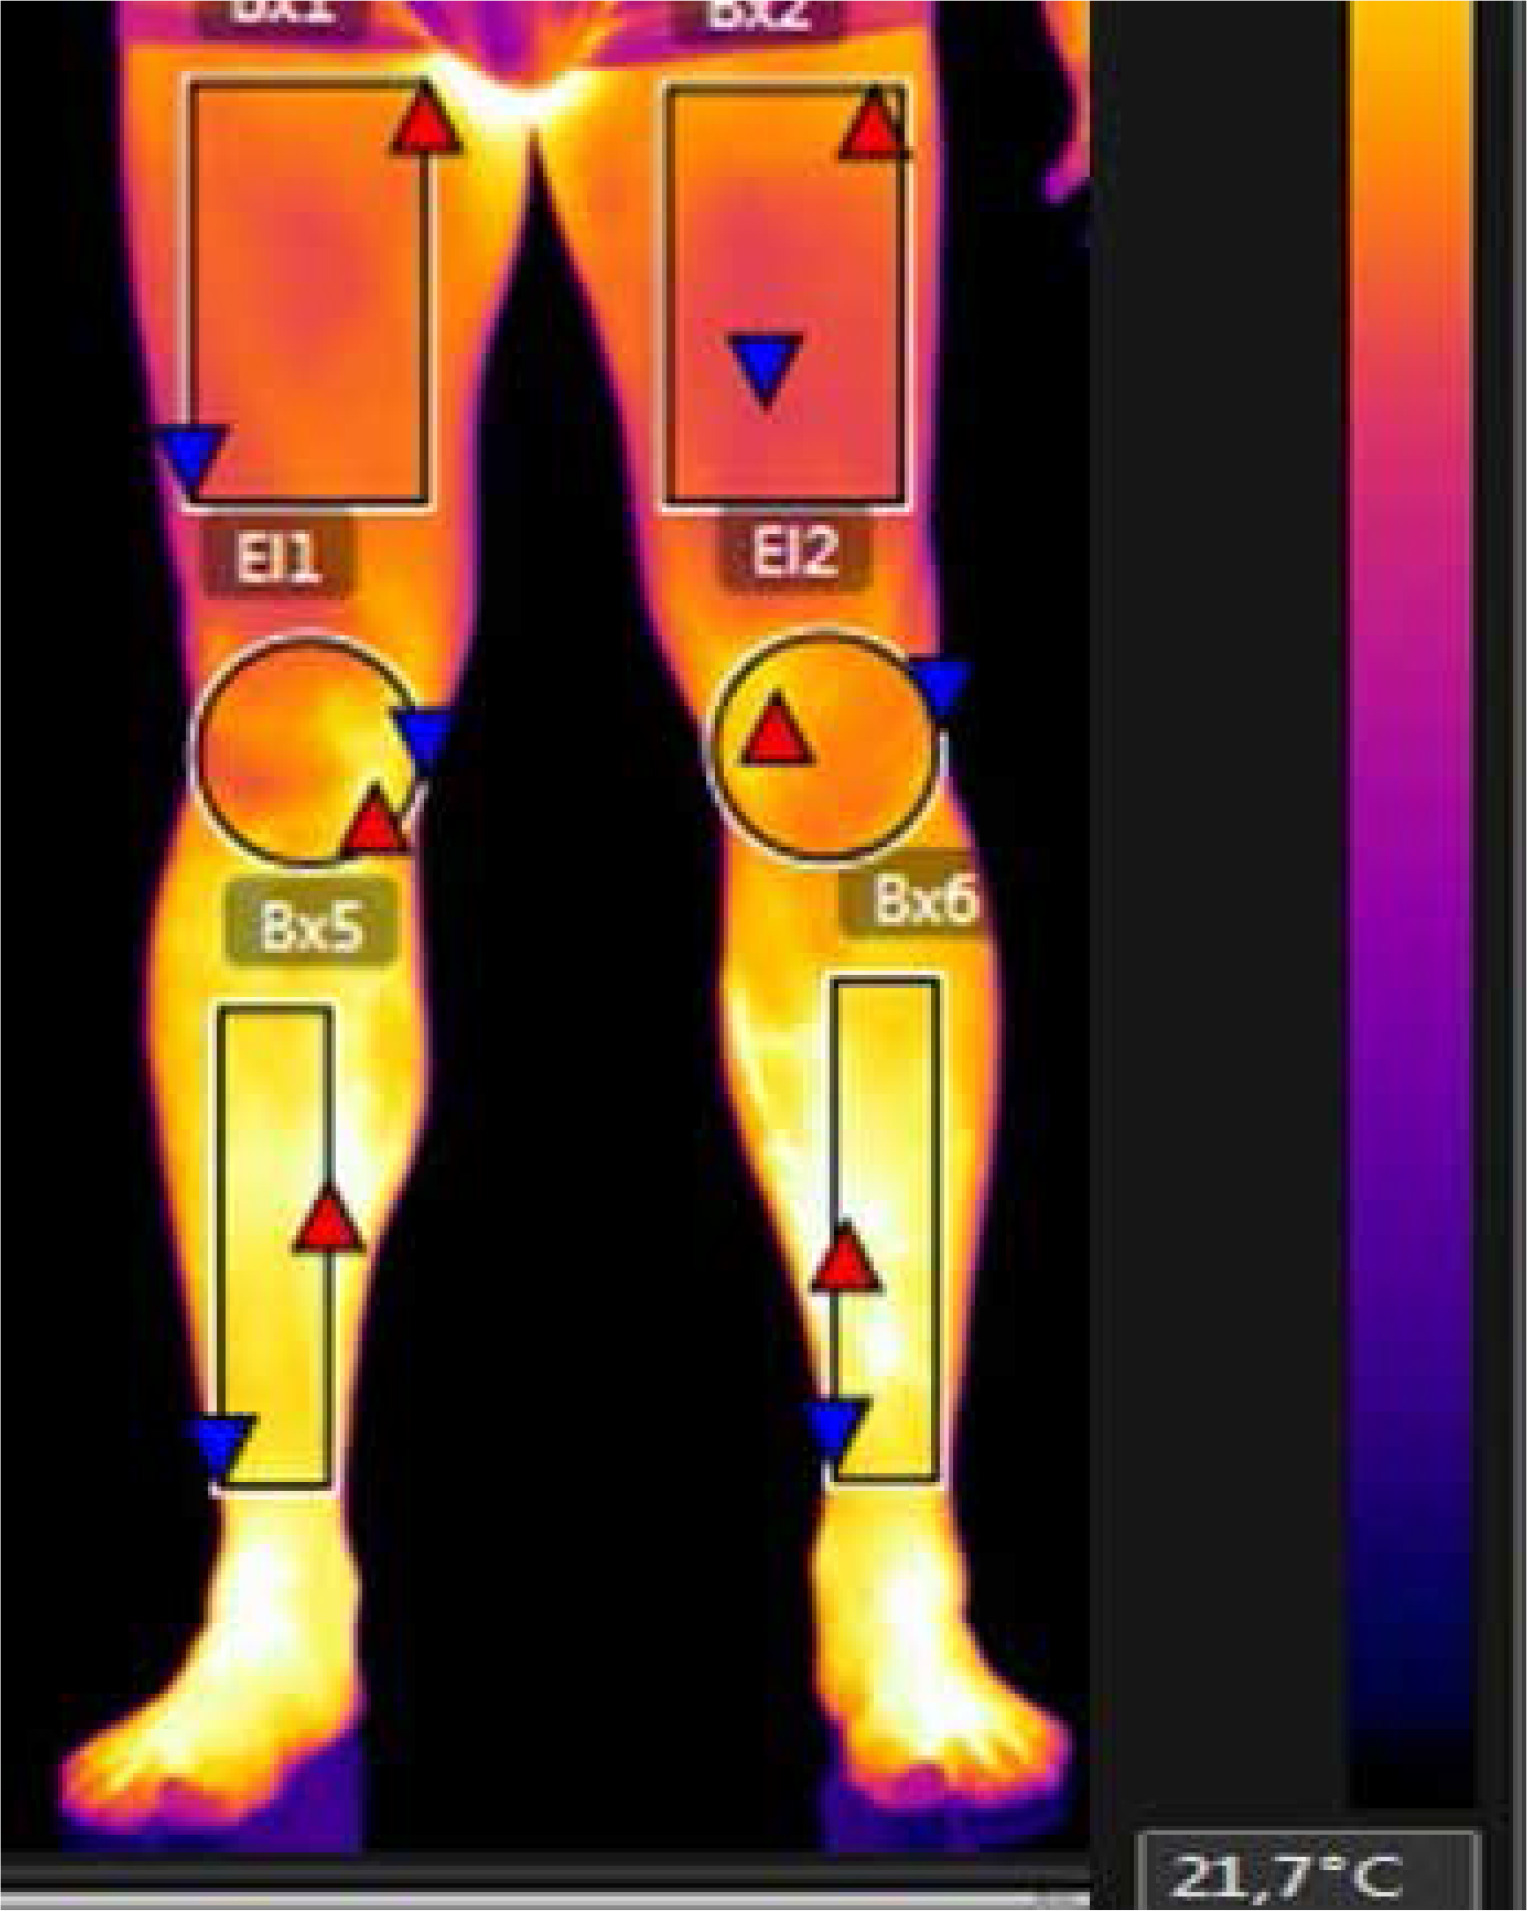
Thermal images were analyzed by FLIR Tools software. The average temperature was measured in degrees Celsius in each region of interest (ROI). The ROIs were rectangles determined by anatomical points, namely: thigh (5 cm above the superior border of the patella and 5 cm below the inguinal line) and leg (5 cm below the inferior border of the patella and 10 cm above the malleolus) [21]. The knee region was also assessed by a circle involving the entire anterior knee, between the other two ROIs. All evaluations were conducted in the anterior view as shown in Figure 1.
Fig. 1
Thermographic image showing the region of interest (ROI). Thigh: region defined by the rectangles on the top. Leg: limited by the rectangles on the bottom. Knee: area defined by circles. The image was taken at the Thermography Laboratory of the Institute of Physical Medicine of the Clinicas Hospital, University of São Paulo (Brazil).
After this, pressure pain thresholds (PPT) were evaluated; PPT were assessed by a pressure algometer (Pain Diagnostics, Great Neck, USA). A constant pressure was applied at 1 kg/s until the patient reported the onset of pain or discomfort. Pressure was applied perpendicularly to the skin surface. The reading was expressed in kg/cm2. During the assessment, subjects were instructed to say “stop” as soon as the pressure sensation became painful, and that pressure level was registered. Sites assessed by algometry were: vastus medialis, vastus lateralis, rectus femoris and patellar tendon. These points have already been assessed and described by previous studies [22, 23].
Data analysis
Data analysis was conducted with the statistical package SPSS v.24 for Windows. Data are presented as means ± standard deviations. Normality of data was assessed by the Kolmogorov-Smirnov method. Comparisons between affected and unaffected sides were made by paired Student’s t-test or the Mann-Whitney U test, and associations between variables were evaluated by Pearson or Spearman’s correlation coefficient, and classified as follows: 0.0 to 0.19 – very weak correlation; 0.2 a 0.39 – weak correlation; 0.4 to 0.69 – moderate correlation; 0.7 to 0.89 – strong correlation; 0.9 a 1.0 – very strong correlation. In all cases, the significance level was set at p ≤ 0.05.
Results
Seventeen individuals with knee OA were invited to participate in the study. Out of them, 6 were excluded from the analysis due to having a prosthesis in one knee (n = 1), presenting a history of thrombosis (n = 1) or having bilateral symptoms (n = 4). Baseline characteristics of the remaining 11 patients are shown in Table I.
Table I
Characteristics of study participants
| Variables | |
|---|---|
| N | 11 |
| Age (years) | 63.1 ±9.5 |
| BMI (kg/m²) | 28.7 ±4.0 |
| Affected side (R/L) | 8/3 |
| Time of pain (months) | 57.8 ±40.4 |
| VAS (cm) | 3.6 ±3.5 |
| WOMAC (%) | 31.0 ±19.21 |
The temperature comparison of both affected and unaffected knees revealed a statistically significant difference of temperature between the two sides. This finding is shown in Table II. All other ROI comparisons failed to detect significant differences.
Table II
Comparisons between affected and unaffected sides
There were weak and very weak correlations between the temperature of the affected knee and the other study variables, but they were not significant (Table III).
Discussion
In this case series study, we found a difference in the temperature of the knee ROI between affected and unaffected sides of individuals with knee OA. The non-significant weak and very weak associations between knee temperature and pain intensity, pressure pain tolerance threshold and disability (WOMAC) indicate that cutaneous temperature of the knee seems not to be associated with pain and disability.
Normal patterns of cutaneous temperature are complex; thus, sensorial investigation associated with thermography and a good clinical evaluation should be considered [24]. Hence, our study evaluated the association of thermography and clinical assessments of pain, function, and pain pressure threshold of patients with knee osteoarthritis.
Regarding the sensorial evaluation of PPT, it was expected that the affected side would present a lower pain threshold. Nevertheless, no differences were observed in pain tolerance when comparing the knee affected by OA and the heathy contralateral knee. This was probably due to the central sensitization mechanism that this disease brings about over time [3, 5, 23].
Another interesting fact is that although pain was considered moderate at the time of data collection (mean of 3.6 in VAS), knee temperature was statistically significantly different between affected and unaffected sides. Nonetheless, the difference of 0.3ºC is not relevant. Even though healthy individuals tend to present small differences between body hemispheres (close to 0°C [25]), there was previously reported an average mean difference of 0.4° ±0.3°C [9] between right and left sides of healthy individuals, a value close to the difference observed in the present study.
A recent study [19] aimed at verifying cutaneous temperature of lower limbs in persons with knee OA and healthy individual observed that male patients tend to present a higher temperature in the thigh, and lower in the knee when compared to the control group. No differences were observed among women. When comparing right and left sides, the authors observed significant differences in the popliteal region (higher temperature on the left side) in both patients and controls, a quite unexpected result. In the present study, where patients with unilateral knee OA were included, cutaneous temperature of the anterior joint region of the knee was the only variable presenting a significant difference between affected and unaffected knees. This must have been due to an increase in local catabolic activity in the affected knee, as highlighted by Brito et al. [19].
Regarding disability (assessed by WOMAC), the present data did not reveal an association between this variable and knee temperature. This suggests that, in this group of individuals with knee OA, cutaneous temperature of the knee may not be associated with disability.
Corroborating the study by Tsai et al. [17], no significant associations between knee temperature and any measure of knee pain were found in the present study. Even the objective assessment of PPT was not significantly associated with knee temperature in individuals with knee OA.
The results presented herein are limited and must be considered with caution. This was a pilot study of a case series; therefore a small sample was included, and patients were classified for OA severity. Studies with larger samples that associate thermography with other objective assessments in randomized clinical trials are encouraged.