
Introduction
Rheumatoid arthritis (RA) is a systemic inflammatory disease affecting approximately 0.5–1% of the population [1].
Rheumatoid arthritis patients have a 1.5 to twofold higher risk of developing heart failure (HF) and a twofold increased risk of HF-associated mortality compared to those without RA, even when adjusting for conventional cardiovascular (CV) risk factors and coronary artery disease (CAD). This observation suggests that RA-specific immune/inflammatory pathways and the disease-related cytokine network are significant contributors to this increased risk of HF, but the exact etiology of the increased risk of HF in RA has not been well delineated [2]. The dominant clinical HF phenotype in RA appears to be heart failure with preserved ejection fraction (HFpEF), previously referred to as “diastolic HF” [4]. Heart failure with preserved ejection fraction (EF) is characterized by a normal EF and left ventricular (LV) volumes, but with concentric remodeling or LV hypertrophy. Heart failure with preserved EF is commonly associated with systemic proinflammatory states such as obesity, aging, and diabetes [3].
Tumor necrosis factor (TNF) remains one of the primary cytokines crucial to the pathogenesis of RA. As a pleiotropic cytokine, it plays numerous pathophysiological roles, including involvement in inflammation and immune responses. Furthermore, it has been established that TNF is intricately involved in CV system function, with elevated levels being associated with ischemic heart disease and atherosclerosis. This cytokine has also been implicated in the pathogenesis of HF. The effects of TNF on the myocardium are complex and not yet fully understood. Tumor necrosis factor may mediate cardiac myocyte hypertrophy and influence other pathways involved in cardiac remodeling, ultimately leading to HF.
Less is known about the effects of anti-IL-6 inhibitors in this context. Interleukin-6 is another cytokine that can impair heart function, so theoretically, targeting IL-6 could reduce inflammation and improve cardiac function. At the moment, however, it is not entirely clear whether TNF inhibitors (TNFi) and IL-6 inhibitors (IL-6i) exert any additional beneficial effect on the heart function or if the heart function improvement is only due to the reduction of inflammation [4].
To test this, we recruited patients with RA treated with 2 different TNFi – adalimumab (ADA) and etanercept (ETC) – and compared them with 2 other groups of RA patients treated with tocilizumab (TCZ) and methotrexate (MTX), respectively, in order to determine the direct impact of various biologics and MTX on heart function. To measure this, we determined the LV function and evaluated the influence of disease activity on heart function.
Material and methods
We recruited patients from the local RA database at Department of Internal Medicine Rheumatology and Clinical Immunology, Katowice, Poland. We identified 4 groups of patients: 2 groups treated with TNFi ETC and ADA, patients treated with the IL-6i – TCZ, and patients who were on MTX treatment only. As the control, we included a group of healthy sex- and aged-matched subjects. All patients recruited to the study met the American College of Rheumatology (ACR)/European Alliance of Associations for Rheumatology (EULAR; 2010) classification criteria for RA. We included adult patients (age ≥ 18 years) with disease duration > 1 year, who were treated with a stable dose of biologics and MTX for at least for 6 months. The main exclusion criteria were as follows: clinically significant valvular dysfunction, heart disease, pulmonary arterial hypertension, history of HF, hepatic failure, hypertension, impaired renal function (serum creatinine > 1.4 mg/dl), patients with a history of diabetes mellitus (or fasting blood glucose > 125 mg/dl), pregnant women, hypo- or hyperthyroidism. We also excluded patients with reduced EF < 50%, supraventricular or ventricular arrhythmias, a history of previous myocardial infarction, or poor echocardiographic imaging.
A group of sex-matched healthy volunteers served as the control group. At the time of the study, detailed history, physical examination, and analysis of patients’ data were performed. Specifically, we collected data on the time of disease onset, current and previous treatment, and the number of biologics used and discontinued due to failure. As part of the routine clinical assessment, we performed a 28-joint count and calculated the Disease Activity Score, based on the C-reactive protein level (DAS28-CRP). Additionally, several biochemical data were collected, including erythrocyte sedimentation rate, C-reactive protein (CRP), fasting glucose level, creatinine, and glomerular filtration rate values, liver function tests, and thyroid-stimulating hormone level. We also measured the body weight and height to calculate body mass index. Fasting samples were collected between 8 and 9 AM, from a peripheral vein, after resting for at least 10 minutes. Blood samples were centrifuged at 2,000 g and frozen at –80°C for further analysis.
All patients underwent transthoracic echocardiography using a variable-frequency transducer optimized for cardiological examinations (2–4 MHz coupled to the LOGIQ P 6 PRO echocardiographic device), and all measurements were performed by the same experienced sonographer, who was blind to the patient data according to the recommendations of the American Society of Echocardiography (ASE). The left ventricular enddiastolic volume and the left ventricular EF were calculated based on Simpson’s biplane method [9].
In accordance with the recommendations of the ASE, the heart was assessed in the following projections:
parasternal in the long axis of the left ventricle;
parasternal in the short axis – vascular;
parasternal in the short axis at the level of the mitral valve;
parasternal in the short axis at the level of the papillary muscles;
parasternal in the short axis at the level of the apex;
apical four-chamber.
The following parameters were measured from cross-sectional cardiac echocardiographic images:
thickness of the interventricular septum (IVS; mm);
end-diastolic thickness of the posterior wall of the left ventricle (PW; mm);
left ventricular end-diastolic dimension (LVEDD; mm);
left ventricular end-systolic dimension (LVES; mm).
Then, based on the Simpson method, in accordance with the American Society of Echocardiography, the EF (%) was calculated using the following formula:
Left ventricular mass and left ventricular mass index were also calculated according to the following formulas:
where: BSA – body surface area (g/m2), IVSd – interventricular septal thickness at end-diastole (mm), LVEDD – LV end-diastolic dimension (mm), LVM – LV mass; LVMI – left ventricular mass indexed to body surface area (g/m2), PWd – left ventricle posterior wall thickness at end-diastole (mm), RWT – relative wall thickness, defined as twice the thickness of the posterior wall divided by the diastolic diameter of the left ventricle; a measure of LV geometry that may be a marker of adverse events in patients with LV dysfunction.
Based on the examination, morphological changes in the heart were classified into one of 4 morphological groups, taking into account the values of LVMI and RWT calculated during echocardiography.
On this basis, LV geometry was classified into 4 types:
normal geometry – both LVMI and RWT within normal values;
concentric remodeling (concentric remodeling) – RWT values above normal with normal LVMI values;
concentric hypertrophy – both LVMI and RWT exceed normal values;
eccentric hypertrophy – LVMI values above normal with normal RWT values.
In all patients, heart function was assessed using electrocardiography.
The electrocardiogram (ECG) examination was conducted after a 5-minute rest. The ECG curve was analyzed for conduction rhythm disturbances and the occurrence of ischemic changes. In addition, the following parameters of the ECG curve were measured:
The QT interval was measured manually on a 12-lead ECG, from the beginning of the QRS complex to the end of the T wave. When U waves were present, the QT interval was measured at the peak of the curve between the T and U waves. The QT interval was measured in lead II, in accordance with the recommendations of the American College of Cardiology (ACC). When measurement in lead II was not possible due to low wave amplitude, measurement was performed in V5 or V6. Literature data indicate high agreement between automatic and manual QT measurement.
The corrected QT interval was calculated using the Bazett formula, as follows:
RR – interval from the beginning of the QRS complex to the beginning of the next QRS complex, measured in seconds.
Normal and prolonged values of the QT interval were corrected according to the Bazett’s formula (based on simultaneous ECG measurements from limb and precordial leads).
According to the American Heart Association (AHA)/American College of Cardiology (ACC) guidelines, QTc interval was considered prolonged if it was > 450 ms in men and > 460 ms in women.
Treatment arms
Four groups defined by treatment were identified. All patients who received biologic treatments were undergoing therapy for a minimum duration of 6 months and received MTX in a stable dose for at least 8 weeks. Patients in the TCZ arm received TCZ in a dose of 162 mg subcutaneously weekly. The ETC group consisted of patients receiving 50 mg of ETC subcutaneously weekly, and ADA patients received 40 mg of ADA subcutaneously biweekly. Patients on synthetic disease-modifying antirheumatic drugs (DMARDs) were on MTX only at a dose of 25 mg, either alone or combined with a low dose of prednisone (or equivalent) in doses not exceeding 10 mg per day.
Statistical analysis
Statistical analyses were conducted using the software packages STATISTICA 13.0 PL (TIBCO Software Inc., Palo Alto, CA, USA), StataSE 13.0 (StataCorp LP, TX, USA), and R (R Foundation for Statistical Computing, Vienna, Austria). The threshold for statistical significance was established at a p-value < 0.05, and all tests were two-tailed. Missing data were not imputed. Nominal and ordinal variables were presented as percentages, while interval data were shown as mean ±standard deviation for normally distributed data. For data with a non-normal distribution, results were reported as median with interquartile range.
The Shapiro-Wilk test and quantile-quantile (Q-Q) plots were used to assess data normality, and the Levene test was applied to check for homogeneity of variances. Group comparisons for interval data were made using one-way ANOVA with Tukey’s post-hoc test, with a logarithmic transformation applied to skewed data as needed. Nominal and ordinal variables were analyzed using the χ² test. To evaluate associations between variables, a multivariable linear regression model with backward stepwise elimination was used, with Cook’s distance values identifying potential outliers. Residuals were tested for heteroscedasticity using the Breusch-Pagan and Cook-Weisberg tests, as well as the Cameron-Trivedi decomposition test. Multicollinearity was evaluated through the variance inflation factor (VIF), with values below 5 considered acceptable. Model fit was assessed with the F test and the R² determination coefficient. Depending on data distribution, correlations were assessed using Pearson or Spearman correlation coefficients. A sample size of at least 21 participants per group was targeted to ensure a study power of 80%.
Bioethical standards
The study was carried out according to the Declaration of Helsinki, and the study protocol has been approved by the local bioethical committee at the Medical University of Silesia, Katowice, Poland (approval number PCN/CBN/0052/KB/129/22, signed 29.11.2022). All patients and controls signed informed consent prior to enrollment in the study.
Results
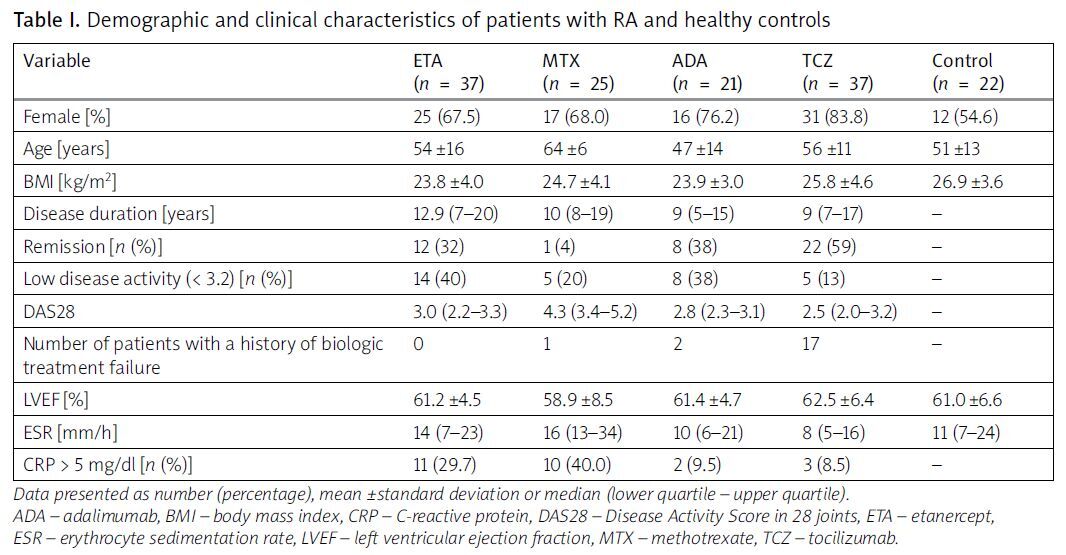
From the biologics database at the local University Hospital, we recruited 120 patients with RA, comprising 89 females (74%) and 31 males (26%), with a mean age of 56 ±10 years. A control group consisting of 22 healthy volunteers, matched for sex and age, with a mean age of 56 ±13 years, was also included. Based on their current treatment regimens, we categorized the patients into 4 groups: those receiving MTX monotherapy and those treated with one of 3 different biologics: ETC, ADA, and TCZ. Specifically, 37 patients were treated with ETC, 21 with ADA, and 37 with TCZ. Additionally, among the RA patients, 20 had previously experienced failure with one biological disease-modifying antirheumatic drug (bDMARD), including golimumab, rituximab, infliximab, and certolizumab pegol. Of these, the majority (15 patients) had subsequently been switched to TCZ.
No significant differences in age or sex distribution were observed between the patient and control groups. However, analysis of the different treatment groups revealed that patients receiving MTX were older than those treated with ETC (p < 0.05) and exhibited higher disease activity compared to patients on biologics. The treatment groups were characterized by a predominance of females; however, this predominance was similar across the study groups, and no statistically significant differences were observed when comparing the groups to each other.
Echocardiographic examinations indicated normal left ventricular function in all patients and controls, with no significant differences in EF (%) observed either between the patient and control groups or among the different RA treatment groups. Patients’ and controls’ characteristics are presented in Table I.
Table I
Demographic and clinical characteristics of patients with RA and healthy controls
Analysis of electrocardiographic parameters revealed significant prolongation of the PR interval in patients treated with TCZ compared to the other groups. Conversely, patients treated with ETC exhibited a shorter PR interval relative to the other groups (p < 0.05). QTc prolongation was not observed in any of the groups studied (p = 0.37; Table II).
Table II
Electrocardiographic parameters in study groups
| Variable | ETC (n = 37) | MTX (n = 25) | ADA (n = 21) | TCZ (n = 37) | Control (n = 22) | p |
|---|---|---|---|---|---|---|
| P [ms] | 105.5 ±16.5 | 111.6 ±17.3 | 105.9 ±13.4 | 108.1 ±12.6 | 105.1 ±9.0 | 0.54 |
| PR [ms] | 151.2 ±24.4 | 152.7 ±29.5 | 150.0 ±21.4 | 168.7 ±21.5* | 159.3 ±21.1 | < 0.05 |
| QRS [ms] | 99.3 ±8.4 | 99.2 ±8.5 | 96.2 ±7.5 | 95.1 ±9.6 | 94.3 ±8.9 | 0.15 |
| QT [ms] | 391.8 ±22.8 | 383.2 ±24.9 | 389.1 ±27.8 | 389.8 ±25.6 | 379.1 ±14.3 | 0.36 |
| QTc [ms] | 424.3 ±21.1 | 414.6 ±24.5 | 419.9 ±13.1 | 415.5 ±20.8 | 419.9 ±16.6 | 0.37 |
Among the assessed echocardiographic values, statistically significant differences were observed only for left atrial (LA) and right ventricle (RV) dimensions. Patients treated with ADA had significantly smaller LA dimensions compared to those treated with MTX and TCZ (p < 0.01). Similarly, RV dimensions were significantly smaller in patients treated with ADA compared to those treated with MTX (p < 0.05; Table III).
Table III
Echocardiographic parameters and analysis between study groups
| Variable | ETC (n = 37) | MTX (n = 25) | ADA (n = 21) | TCZ (n = 37) | Control (n = 22) | p |
|---|---|---|---|---|---|---|
| LA [mm] | 34.8 ±6.0 | 37.4 ±5.4 | 31.1 ±5.0 | 36.1 ±5.7 | 35.4 ±4.9 | < 0.01* |
| LVEDd [mm] | 48.9 ±4.1 | 49.7 ±6.5 | 46.4 ±2.9 | 48.2 ±4.6 | 49.0 ±4.8 | 0.18 |
| LVESd [mm] | 29.1 ±4.4 | 30.6 ±7.6 | 27.0 ±3.0 | 28.3 ±5.8 | 29.2 ±5.5 | 0.26 |
| Opening [mm] | 21.8±2 | 20.8 ±2.1 | 21.1 ±2.1 | 21.8 ±1.7 | 21.5 ±2.1 | 0.23 |
| Ao [mm] | 33.6 ±3.3 | 35±4 | 32.6 ±3.4 | 33.6 ±2.9 | 32.8 ±3.7 | 0.12 |
| RVEDd (RV) [mm] | 25.6 ±3.6 | 28.1 ±4.5 | 25.1 ±3.5 | 26.2 ±2.9 | 27.5 ±3.3 | < 0.05** |
| IVSd [mm] | 10.1 ±1.1 | 10.5 ±1.4 | 9.7 ±1.4 | 10.2 ±1.3 | 10.2 ±1.3 | 0.33 |
| PWTd (LVPW) [mm] | 9.8 ±0.8 | 10.1 ±1.1 | 9.8 ±0.7 | 9.8 ±0.9 | 9.9 ±1 | 0.59 |
| LVEF [%] | 62.1 ±4.4 | 58.3 ±8.2 | 61.5 ±4.4 | 62.4 ±6.4 | 60.8 ±6.9 | 0.38 |
| LVM [g] | 175 ±34 | 191 ±52 | 157 ±91 | 173 ±44 | 174 ±46 | 0.11 |
| RWT | 0.40 ±0.05 | 0.41 ±0.06 | 0.42 ±0.03 | 0.41 ±0.05 | 0.40 ±0.05 | 0.71 |
| RWT > 0.42 [n (%)] | 11 (31.4) | 14 (56.0) | 10 (47.6) | 15 (40.5) | 7 (31.8) | 0.31 |
| LVMI | 96.7 ±13.3 | 106.8 ±23.0 | 90.9 ±14.4 | 98.0 ±21.8 | 92.4 ±20.9 | < 0.05** |
| LVMI-H* [n (%)] | 10 (28.6) | 14 (56.0) | 4 (19.0) | 18 (48.7) | 5 (22.7) | < 0.05*** |
| Post-hoc Tukey test analysis between groups | ||||||||||
| Variable | ETC-MTX | ETC-ADA | ETC-TCZ | ETC-C | MTX-ADA | MTX-TCZ | MTX-C | ADA-TCZ | ADA-C | TCZ-C |
| DAS28 | < 0.05 | – | < 0.01 | < 0.01 | – | – | – | |||
| LA | < 0.01 | < 0.05 | ||||||||
| RV | < 0.05 | |||||||||
ADA – adalimumab, Ao – aortal diameter, DAS28 – Disease Activity Score in 28 joints, ETA – etanercept, IVSd – interventricular septal thickness, LA – left atrium, LVEDd – left ventricle end diastolic diameter, LVESd – left ventricle end systolic diameter, MV – mitral valve diameter, PWTd – posterior wall thickness in end-diastole, RVEDd – right ventricle end diastolic diameter, LVEF – left ventricle ejection fraction, LVM – left ventricle mass, LVMI – left ventricle mass index, LVMI-H – left ventricular mass hypertrophy index, LVPW – left ventricle posterior wall, MTX – methotrexate, RV – right ventricle, RWT – relative wall thickness, TCZ – tocilizumab.
As regards heart function, EF correlated inversely with disease activity; however, this correlation was significant (ρ = –0.175; p < 0.05) only when all patients with RA (biologics and MTX together) were combined.
Echocardiography revealed a normal EF (> 50%) in all recruits. A lower value was observed in patients treated with MTX, but without statistical significance.
Left ventricular mass index was the lowest in patients treated with ADA, and significantly lower compared to patients treated with MTX (p < 0.05). The LVMI is considered high in the case of values > 95 g/m2 for women and > 115 g/m2 for men. In the study, the highest percentage of people with an increased index was recorded in the group using MTX, and the lowest in the ADA group (Table III).
The LVMI correlated positively with age and NT-pro brain natriuretic peptide (NT-proBNP) concentration, and vice versa with patients’ sex and hemoglobin concentration (Table IV).
Table IV
Results of linear regression for log10 (LVMI) per change of one standard deviation
The highest percentage of patients with concentric LV hypertrophy was observed in patients using MTX. It was significantly higher in patients treated with TNFi in comparison to controls (p < 0.05; Table V).
Table V
Types of heart hypertrophy
| Variable | ETC (n = 37) | MTX (n = 25) | ADA (n = 21) | TCZ (n = 37) | Control (n = 22) | p |
|---|---|---|---|---|---|---|
| Concentric hypertrophy [n (%)] | 2 (5.7) | 10 (40.0) | 2 (9.5) | 8 (21.6) | 3 (13.6) | < 0.05* |
| Eccentric hypertrophy type [n (%)] | 8 (22.9) | 4 (16.0) | 2 (9.5) | 10 (27.0) | 2 (9.1) | |
| Valid geometry type [n (%)] | 16 (45.7) | 7 (28.0) | 9 (42.9) | 12 (32.4) | 13 (59.1) | |
| Remodeling type [n (%)] | 9 (25.7) | 4 (16.0) | 8 (38.1) | 7 (18.9) | 4 (18.2) |
Discussion
The objective of this study was to investigate whether TNFi and IL-6i treatment exerts beneficial effects on the CV system or if the observed changes in CV function in patients with RA are exclusively due to the inhibition of inflammation, irrespective of the method employed to achieve this suppression, such as conventional DMARDs, TNFi or IL-6i. Additionally, the study aimed to determine whether TNFi possess unique properties that influence cardiac function, independent of their ability to reduce the concentration of this cytokine.
This objective was accomplished by evaluating cardiac function through echocardiography, which included the measurement of left ventricular systolic fraction and left ventricular mass. Additionally, electrocardiogram recordings were analyzed, and patients were selected based on comparable disease activity, assessed using the DAS28 disease activity scale for RA.
Analysis of the different treatment groups revealed that patients treated with MTX were older than those treated with TNFi (p < 0.01). This may at least partially explain differences in other parameters studied [5].
Echocardiographic assessments indicated normal left ventricular function across both patient and control groups, with no significant differences in EF% between the two. This is consistent with existing clinical guidelines for initiating biologic therapy, which recommend treatment for patients with normal systolic function, while advising cautious administration in patients with moderate HF classified as New York Heart Association (NYHA) class I/II. This restriction also applied to TCZ, but not to MTX, as local guidelines do not require assessment of heart function for its use.
Nevertheless, within this relatively homogeneous cohort, subtle cardiac changes were detected, potentially attributable to the varying biologic treatments administered among the patients.
A detailed analysis of echocardiographic parameters provided valuable insights into cardiac structure in RA patients. Specifically, patients in the MTX group demonstrated the highest prevalence of LV hypertrophy, with concentric hypertrophy being the most commonly observed pattern. This was accompanied by a notably elevated LVMI, suggesting that MTX treatment is associated with structural cardiac changes in this cohort. Our findings are in agreement with prior cross-sectional RA studies which also demonstrated that concentric geometry is the most prevalent remodeling form [6]. This is notable, as concentric geometry (remodeling and/or hypertrophy) has been linked to increased CV events, including HF, in the general population. Conversely, patients treated with ADA demonstrated the lowest LVMI, which was significantly lower than that of patients in the MTX group (p < 0.05). This finding may indicate a cardioprotective effect of biologic therapies, potentially reducing LV mass alterations, as was previously reported [7]. However, in this instance, our findings should be interpreted with caution. As previously established, patient age plays a substantial role in influencing LV geometry, highlighting the process known as vascular aging. This phenomenon may account for observed changes in LV geometry within the MTX group, which included statistically older patients than other groups [5]. In the present study, we observed a high prevalence of LV hypertrophy, affecting 46 patients (38%), which aligns with recent data reporting a prevalence of up to 47% for all forms of LV hypertrophy [8]. However, in our study, the MTX group significantly contributed to this elevated frequency, with LV hypertrophy observed in 56% of patients within this group. Given the higher disease activity observed in patients within the MTX group, we can hypothesize that the more favorable LV parameters in the biologic treatment groups (including TNFi or TCZ) may be at least partially attributable to the effects of these therapies. These findings suggest that effective biologic treatment might play a role in supporting normal LV structure in these patients. Left ventricle remodeling is prevalent in RA patients without clinical HF and increases to 60% over time. This is again in agreement with the results of our study, where no systolic dysfunction was found among the patients with RA [9]. Our findings demonstrated a positive correlation between increased LV mass and elevated NT-proBNP levels, a recognized biomarker of HF. Considering that concentric remodeling often underlies diastolic dysfunction – the most prevalent type of HF in patients with RA – this association may suggest subclinical diastolic HF in patients treated with MTX and highlights a potential cardioprotective effect of biologic therapies [10].
Our study reported numerically lower QTc interval values in patients treated with TCZ compared to patients treated with ADA and ETC, which, however, was not statistically significant (p = 0.37). The obtained data are in contrast with the results of the work of Lazzerinini et al. [11], who observed a statistically significant shortening of the QTc interval in patients undergoing treatment with TCZ. Our results are also in contrast to the findings of Erre et al. [12], who observed higher QTc and QTd values and longer QTd prevalence in RA patients compared to controls. Of note is also the fact that patients on ETC had numerically, but statistically non-significantly, longer QT and QTc intervals compared to the other groups. This however may be explained by the higher but statistically non-significant female prevalence in this group compared to the other treated groups. It was established several decades ago that females are characterized by longer QT and QTc, which is mainly due to the effects of female sex hormone activity on the conduction system and cardiac ion channels [13].
Corrected QT interval prolongation is commonly seen in patients with elevated CRP, which robustly reflects IL-6 activity [14]. Moreover, some experimental models confirmed the proarrhythmogenic role of IL-6 and its direct impact on potassium channels [15].
In our cohort of patients, the vast majority of subjects were characterized by normal or lower CRP concentration, which in turn may translate to a lack of differences between the groups.
To our surprise, we observed a longer PR interval in the TCZ group (p < 0.05). The reason for this phenomenon is largely unknown. We may only speculate that targeting IL-6 may have a direct impact on cardiac channel ion function. As was established some years ago, the inflammatory state observed in RA contributes to modification of cardiac channel function (inflammatory cardiac channelopathy); thus, reduction of one of the most powerful proinflammatory cytokines may change cardiac ion function, seen here as the longer PR interval [16].
The results of our study might be surprising in the light of the well-known impact of RA on QT and QTc values [17]. We want, however, to underline that in the special instance of biologic therapy, this kind of treatment may potentially offer additional therapeutic potential and reduce the risk of developing cardiac arrhythmias [11, 18]. In RA, prolonged QT is the result of the active phase of RA. Hence, suppression of inflammation directly translates to QTc normalization, as was observed in our study [19].
Conclusions
Numerous epidemiological analyses indicate that patients with RA may benefit from TNFi therapy by reducing the risk of developing HF. However, it is not clear whether TNFi are responsible for this phenomenon or whether this process is caused by a reduction in disease activity and suppression of inflammation, which can also be achieved in other ways (e.g. glucocorticosteroids, DMARDs). All biologics tested demonstrated similar effects on cardiac function and structure, showing either positive or neutral impacts, while distinctly differing from MTX in their ability to reduce disease activity. Striking differences were observed when comparing patients on biologics to those on MTX. Patients receiving MTX exhibited higher frequencies of LV hypertrophy, which may predispose them to diastolic HF. Notably, biologics appear to offer a protective influence on cardiac structure, potentially preventing progression to HF. One possible explanation is the superior suppression of disease activity achieved by biologics, which may help prevent further structural cardiac damage. Among the biologics, ADA may exhibit additional protective properties, as patients in the ADA group presented with smaller cardiac chamber sizes and the lowest incidence of LV hypertrophy. However, due to the relatively small sample size in the ADA group, there is a risk of statistical bias, and further studies with larger samples are needed to confirm these findings and draw definitive conclusions. Another factor that may potentially influence statistical bias is the fact that, unlike biologics, the use of MTX is not restricted to patients free from HF. However, in this study, we did not recruit patients with any signs of HF, and normal cardiac function was observed in all groups, including those receiving MTX.