Introduction
Epidemiological trends in fragility fractures observed in developed countries are likely attributable to population aging. Over recent decades, this trend has been accompanied by a significant increase in the prevalence of osteoporosis among postmenopausal women. Osteoporosis is diagnosed based on decreased bone mineral density (BMD) measured by dual-energy X-ray absorptiometry (DXA). According to the World Health Organization (WHO) definition, osteoporosis is defined when the BMD T-score is ≤ –2.5 [1–3]. Since a normal BMD result does not exclude the risk of a fracture, it is crucial in the osteoporosis diagnostic process to identify those with a high fracture risk who require treatment. Previous studies have shown that up to 70% of fractures occur in individuals who do not meet the densitometric criteria for osteoporosis [4]. As reported by Siris et al. [5], there is no direct correlation between BMD and fracture incidence, as most fractures occur in individuals with osteopenia. This may be explained by the fact that osteoporosis is associated not only with a reduced bone mass, but also with a degraded bone microarchitecture and clinical risk factors. Therefore, BMD alone is insufficient for fracture risk assessment and it requires supplementary methods [6, 7].
To improve fracture risk assessment, the Fracture Risk Assessment Tool (FRAX) calculator was developed in 2008. It is an algorithm that estimates 10-year probability of hip and major osteoporotic fractures. Additionally, in 2012 the United States Food and Drug Administration accepted the trabecular bone score (TBS) as a supplementary diagnostic tool for fracture risk assessment. The trabecular bone score is calculated based on a DXA lumbar spine scan (L1–L4) [8]. In patients with similar BMD values, TBS provides additional information on possible bone microarchitecture [9, 10]. Numerous studies have reported that the indirect bone microarchitecture analysis using the TBS predicts fracture risk independently of BMD, with comparable AUC values [7, 11–17]. The growing clinical utility of TBS has also been reaffirmed in recent expert reviews [18]. Since 2015, the FRAX calculator has been updated to incorporate bone microarchitecture analysis derived from TBS [2, 3].
Despite the widespread international acceptance of DXA-based BMD assessment, as well as FRAX and DXA-derived TBS [2, 3, 18], their performance requires local validation, as FRAX models are calibrated to country-specific epidemiological data and fracture rates [2]. The number of studies analysing the predictive value of TBS in various diagnostic models incorporating skeletal and other risk factors in the Polish population remains limited. Local epidemiological data indicate a substantial treatment gap among individuals with fragility fractures [19], underscoring the need for improved diagnostic strategies in this population. Furthermore, access to TBS analysis in Poland remains restricted, emphasizing the need for expanded local research to support the clinical implementation of fracture risk assessment models incorporating bone microarchitecture. Accordingly, the present study was undertaken in this population. The aim of the study was to assess the diagnostic value of DXA-based assessment, including BMD (spine and hip when available) and DXA-derived TBS, in fracture risk prediction in Polish women aged ≥ 50 years at risk of osteoporosis, in combination with other relevant factors (such as FRAX).
The present study is expected to provide clinically relevant evidence on the predictive performance of different combinations of diagnostic tools for clinical use. Integrating commonly used assessment methods may enhance fracture risk stratification in postmenopausal women and support the wider implementation of TBS in Poland. Therefore, this may support a reduction in fragility fracture occurrence and facilitate the development of more effective management strategies for individuals aged ≥ 50 years at high risk of osteoporotic fractures in the Polish population.
Material and methods
Study design and study population
A prospective study with follow-up was conducted between 2010 and 2019 at the Rehabilitation Clinic of the Jagiellonian University Medical College and the Cracow Medical Centre (CMC).
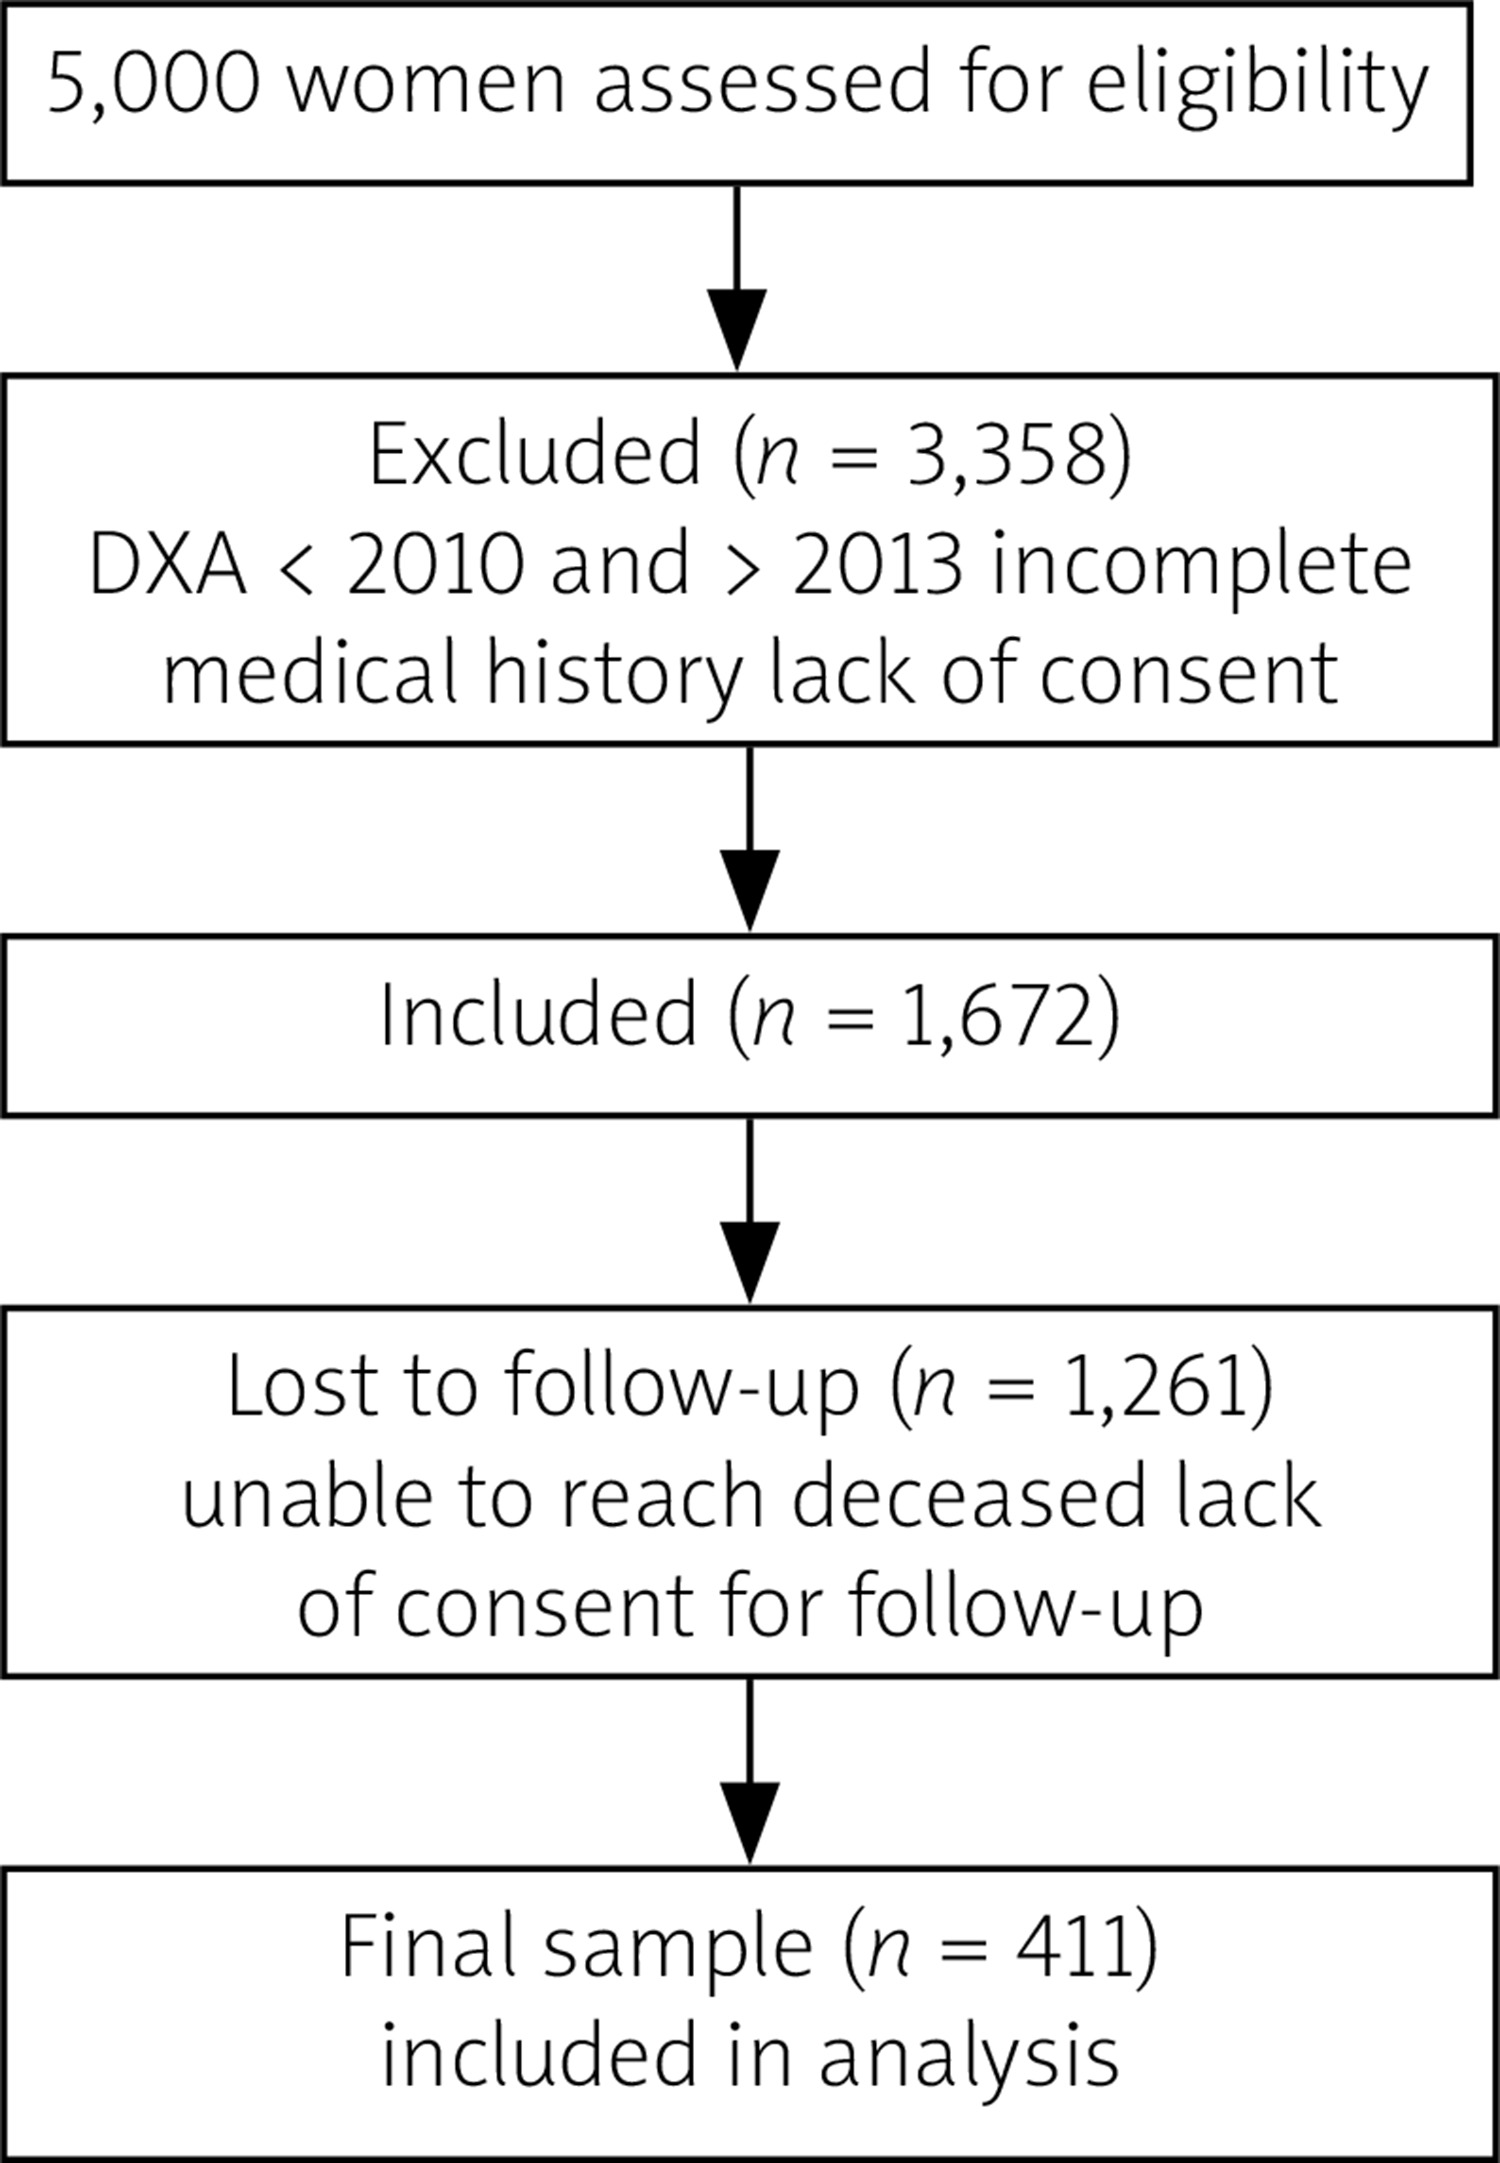
To conduct the study, a group of 5,000 women aged ≥ 50 years was randomly selected from a database of 59,270 CMC patients. These patients had been admitted for diagnostic purpose and had undergone at least lumbar DXA examination at the facility. Menopausal status was confirmed in each patient via a medical questionnaire, which documented the age of the last menstrual period. The mean age at menopause was 49.9 ±5.3 years (range: 21–65). As age at menopause was self-reported, it may be subject to recall bias, particularly in older participants and those with surgically induced menopause. Following the randomization process, all women included in the analysis were required to meet the following inclusion criteria: aged 50–85 years at the time of DXA examination and confirmed postmenopausal status. Additionally, all participants were required to have a lumbar spine DXA scan (L1–L4) performed on the same device and complete a baseline medical questionnaire (including written informed consent), both conducted between 2010 and 2013. The study excluded women who did not meet the above inclusion criteria and also cases with spine DXA scans with significant artefacts or technical errors. Additionally, women with conditions that significantly distort DXA or TBS interpretation (e.g. severe scoliosis) and also mental or neurological disorders that prevent the collection of information and may undermine the reliability of the research were excluded.
Finally, in a group of 411 women the authors conducted telephone questionnaires that enabled collection of a complete set of data required for planned analysis. Details of the randomization process are presented in Figure 1.
Clinical data collection and dual-energy X-ray absorptiometry assessment
The questionnaire included demographic and anthropometric data, comorbidities and medication use. An additional section addressed fracture risk factors, with particular emphasis on the number of sustained fractures (type, location and circumstances of the incident). A trained member of the clinical staff assessed whether the fracture could be classified as a low-energy trauma (e.g., falls). Prior to DXA examination, each patient’s height and weight were measured using calibrated and certified equipment. Subsequently, the radiology technician performed a lumbar (L1–L4) and, in selected cases, a hip (neck) DXA scan (57.2% of cases) using a Hologic Delphi W densitometer (SN70622; software version 11.7), in accordance with the recommendations of the International Society for Clinical Densitometry [20]. Bone mineral density classification was based on WHO criteria for T-scores cut-off values for spine and hip locations (T > –1 normal; –2.5 to –1 osteopenia; T ≤ –2.5 osteoporosis) [1–3].
Follow-up assessment
Follow-up assessment was conducted as a single telephone interview between January 2018 and December 2019 by the author (M.W.) of the study. The duration of follow-up was calculated individually from the date of the baseline DXA examination and questionnaire (2010–2013), resulting in a variable observation period of 5–9 years (mean 6.5 ±1.0 years). At follow-up, participants completed a questionnaire similar to that used in the baseline assessment. Particular attention was given to incidents involving new fractures: their location, circumstances (low/high energy) and timing. This was intended to ensure that the fracture occurred during the observation period and had not been reported in the first questionnaire.
Retrospective trabecular bone score assessment
All participants (n = 411) underwent additional analysis of their spine DXA scan (L1–L4) using Trabecular Bone Score iNsight software (ver. 2.0). Trabecular bone score is a quantitative textural index derived from DXA images and does not represent a separate imaging modality. Instead, it constitutes an analytical extension of standard DXA-based BMD assessment. This TBS evaluation was performed retrospectively during the follow-up phase using the baseline DXA scans obtained between 2010 and 2013. Following the TBS methodology guideline, published by the tool manufacturer, any patients outside the relevant body mass index (BMI) range (15–37 kg/m2) were excluded from further analysis. The cut-off points for bone microarchitecture degradation and fracture risk used in our study were: > 1.31 normal microarchitecture (low risk), 1.23–1.31 – partially degraded microarchitecture (average risk), < 1.23 degraded microarchitecture (high risk) [12].
Fracture risk assessment
After all information regarding the skeletal DXA-based parameters (BMD and TBS) and other clinical fracture risk factors had been obtained (by questionnaire), every member of the study group had their fracture risk calculated using the FRAX algorithm (available online at https://www.sheffield.ac.uk/FRAX/tool.aspx?lang=po). FRAX probabilities were calculated retrospectively during the follow-up phase. The probability was calculated for both the hip and major osteoporotic fracture (MOF) using BMI (for every patient) and also hip BMD (for 57.2% of the study group) along with TBS. A FRAX MOF probability of > 10% was considered high risk, 5–10% average risk and < 5% low risk. For hip fracture risk, a FRAX probability > 3% was considered high risk [21]. Although FRAX was originally developed to estimate 10-year risk, previous studies have reported that it may be efficiently used for shorter observation periods. This served as a rationale to use FRAX in the present study [22].
Statistical analysis
Upon the completion of data collection, the authors conducted a statistical analysis using Statistica 13 software. The list of tests included those for quantitative variables (Shapiro-Wilk, Kolmogorov-Smirnov tests), frequency analysis (Pearson χ2 and Fisher tests) as well as the dependency analysis (Student’s t-test, Mann-Whitney U test and ANOVA tests). The prediction of the classification of data into a state variable was performed using the receiver operating characteristics (ROC) curve and area under the curve (AUC), whereas for data modelling, a logistic regression model was used. In the logistic regression models, TBS and BMD were entered as continuous variables in their original measurement units. Consequently, the reported odds ratios correspond to a 1-unit change, which can yield small OR values. Values of p < 0.05 were considered statistically significant.
Results
A total of 411 women aged 63.5 (50–85; SD 6.6) were finally enrolled in the study at the baseline and lasted until the end, with an average age of 70 (56–90; SD 6.6) years at the follow-up. Detailed characteristics, including anthropometric parameters and all analysed skeletal factors, are presented in Table I. The table summarizes baseline data for the entire cohort and stratifies participants according to whether they sustained a fracture during the follow-up period.
Table I
Characteristics of the study group at baseline, stratified by fracture occurrence during follow-up
| Variables | Baseline | Follow-up | p | ||
|---|---|---|---|---|---|
| Whole study group (n = 411) | Group with a fracture (n = 95) | Group without a fracture (n = 313) | |||
| n | Value | Value | Value | ||
| Age [years] | 411 | 63 (59.0–68.0) | 65.2 ±7.2 | 62.0 (58.0–67.0) | < 0.05 |
| BMI [kg/m2] | 411 | 26.5 (23.9–29.4) | 27.5 ±4.1 | 26.4 (23.7–29.3) | > 0.05 |
| TBS L1–L4 spine | 408* | 1.25 ±0.09 | 1.23 ±0.09 | 1.25 ±0.09 | < 0.05 |
| BMD spine [g/cm2] | 408* | 0.779 (0.720–0.854) | 0.760 (0.688–0.838) | 0.782 (0.731–0.857) | < 0.05 |
| T-score spine | 408* | –2.4 (from –3.0 to –1.8) | –2.6 (from –3.3 to –1.9) | –2.4 (from –2.9 to –1.7) | < 0.05 |
| BMD hip [g/cm2] | 235** | 0.654 (0.597–0.726) | 0.655 ±0.097 | 0.655 (0.605–0.727) | > 0.05 |
| T-score hip | 235** | –1.8 (from –2.3 to –1.1) | –1.8 ±0.9 | –1.8 (from –2.2 to –1.1) | > 0.05 |
| FRAX hip BMI [%] | 411 | 1.1 (0.6–2.4) | 1.6 (0.8–3.1) | 1.00 (0.6–2.1) | < 0.05 |
| FRAX MOF BMI [%] | 411 | 5.3 (3.4–8.0) | 6.4 (3.8–11.0) | 4.7 (3.3–7.6) | < 0.05 |
| FRAX hip BMD [%] | 235** | 1.1 (0.6–2.2) | 1.3 (0.7–2.6) | 1.0 (0.5–2.0) | > 0.05 |
| FRAX MOF BMD [%] | 235** | 5.5 (3.8–8.2) | 6.2 (4.8–8.9) | 5.4 (3.6–7.5) | < 0.05 |
| FRAX hip BMD-TBS [%] | 235** | 1.2 (0.6–2.5) | 1.7 (1.0–2.9) | 1.1 (0.6–2.4) | > 0.05 |
| FRAX MOF BMD-TBS [%] | 235** | 6.8 (4.4–9.8) | 7.2 (5.6–10.0) | 6.5 (4.2–9.2) | < 0.05 |
Using the obtained DXA results (spine and/or hip neck), osteoporosis was diagnosed in over half of the study subjects (51%, n = 210), whereas osteopenia was found in 37% (n = 151) of the group. Notably, only 51% of those with osteoporosis had reported past antiresorptive treatment (defined as use of an active treatment agent for at least 12 months). Among treated patients, bisphosphonates were the most commonly used medications, accounting for 94 cases (88% of all treatment recipients). Reports of the use of other anti-osteoporotic medications were infrequent: hormone replacement therapy (HRT, n = 15), calcitonin (n = 6) and denosumab (n = 2). Approximately 58% of women with a clinical osteoporosis diagnosis received calcium and 43% vitamin D supplementation.
According to baseline data, over 1 in 4 women (n = 113, 27%) had a previously reported fracture before entering our study group. At the end of the study follow-up period, 96 women reported sustaining a new fragility fracture (23%). The most commonly reported locations included Colles (n = 33) and vertebral (n = 33) fractures. In a group of participants with a newly reported fragility fracture (sustained during the study), in 41% of cases it was a re-fracture. Among women who sustained a new fragility fracture during follow-up, 59% (n = 57) reported previous antiresorptive therapies (of which 82% were bisphosphonates). It should be emphasized that the reported past antiresorptive therapy may have influenced fracture risk in the study group. However, exact treatment duration, adherence and timing of therapy in relation to the study period were heterogeneous and not routinely monitored. Therefore, the extent to which previous therapy influenced fracture risk in our cohort should be interpreted with caution. A description of the groups stratified by occurrence of a “new” fracture in shown in Table I.
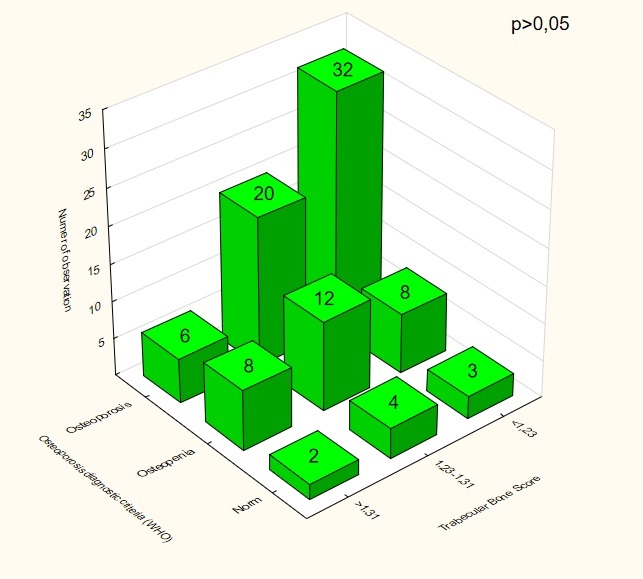
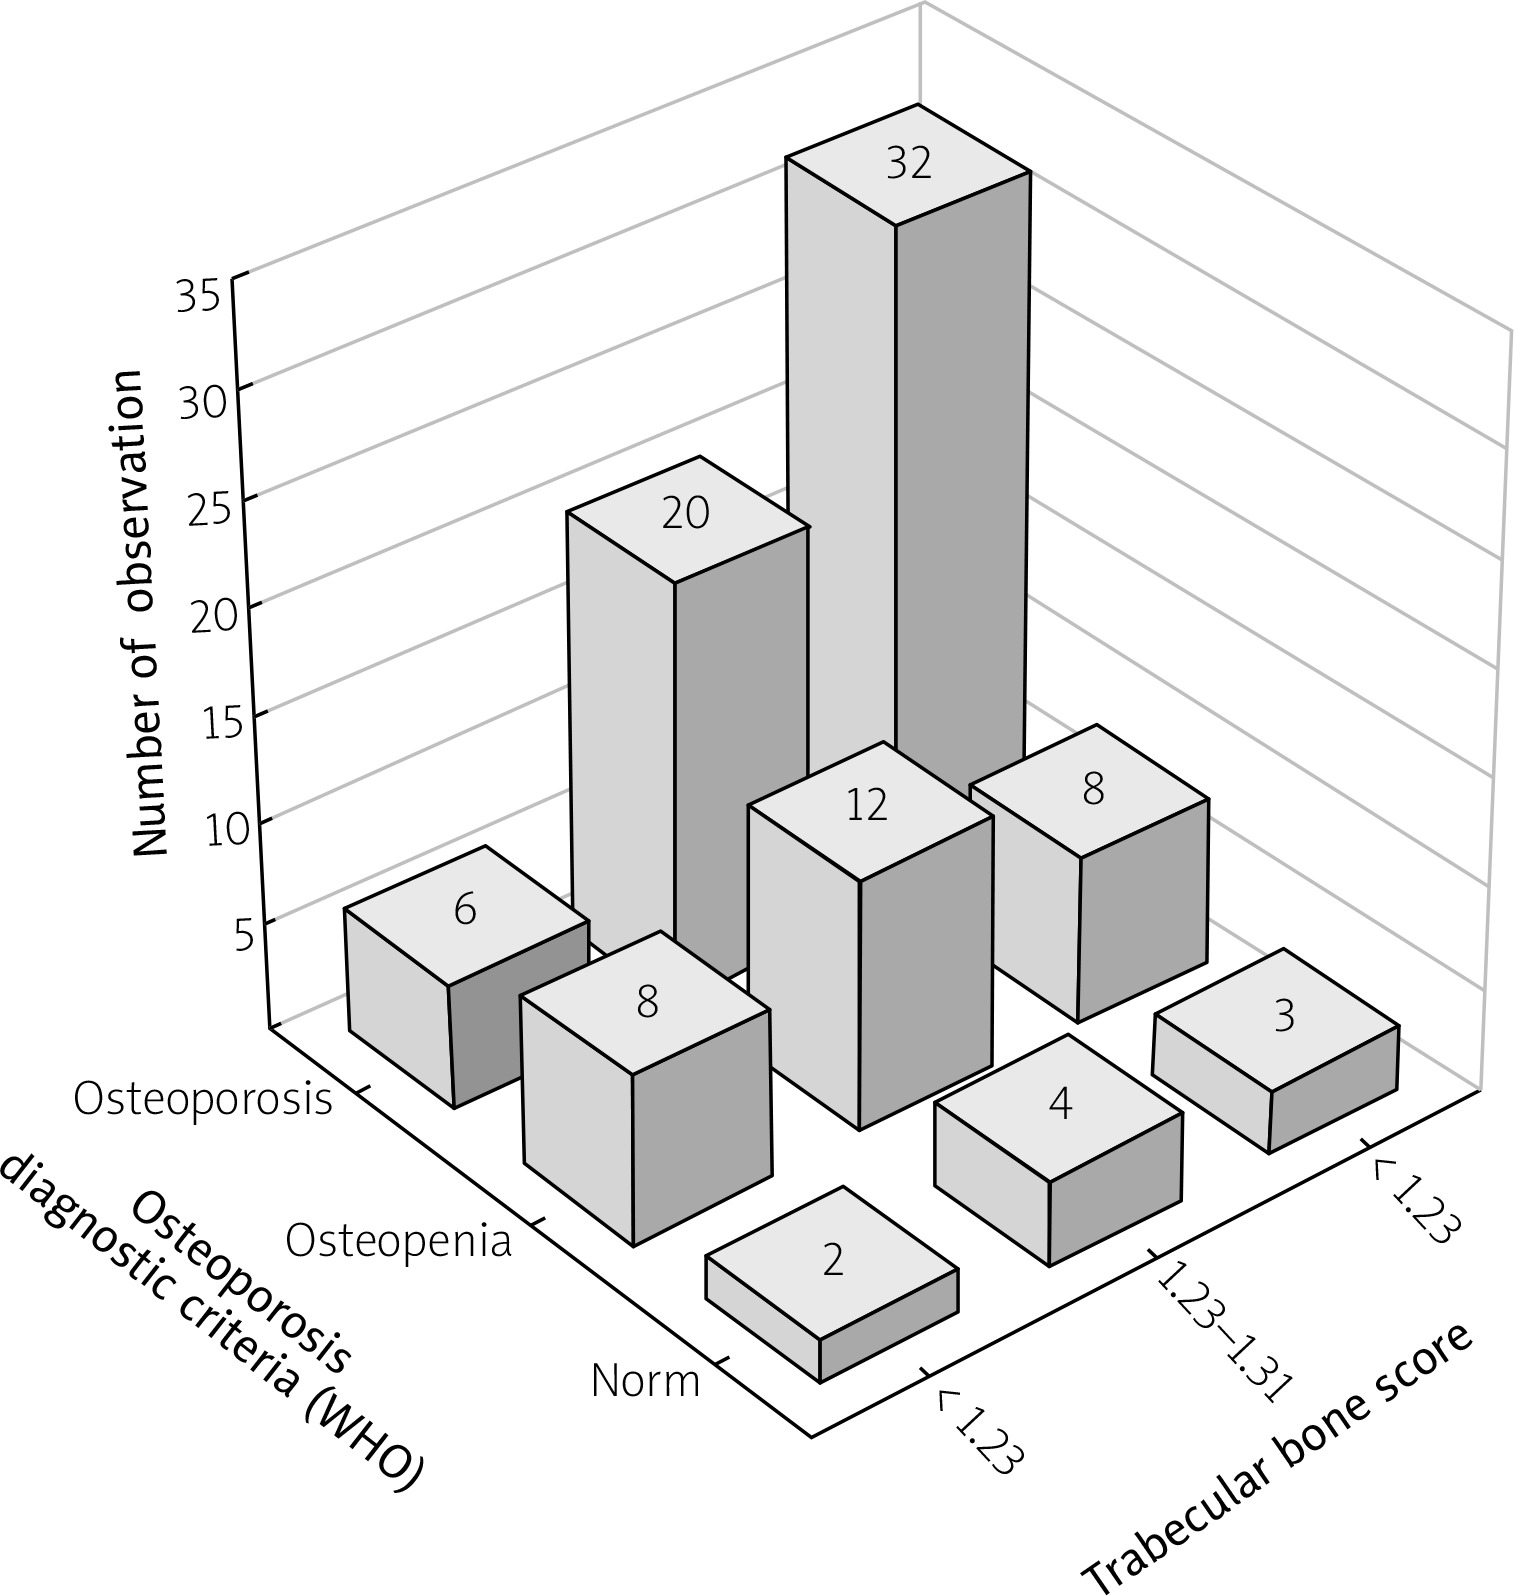
As expected, most patients with low-energy fractures were in the group with a degraded bone microarchitecture and diagnosed osteoporosis. Notably, fracture patients without osteoporosis were still mostly (73%, n = 27) characterised by a partially (43.2%) or significantly (29.7%) degraded bone microarchitecture (Fig. 2).
Fig. 2
Number of cases with a “new” fragility fracture depending on their TBS result and osteoporosis diagnostic criteria as defined by WHO (p > 0.05).
Fracture prediction assessment with ROC curve analysis showed that all analysed variables taken into consideration were characterised by an AUC over 0.5. The highest values (AUC 0.6) were observed for FRAX BMD and FRAX BMD-TBS models (p < 0.05), which incorporate DXA-based skeletal parameters (BMD with or without TBS) together with additional clinical risk factors (Table II). Also, it should be noted that one model (T-score hip) was not statistically significant, which may have been attributable to the lack of data regarding hip DXA (as mentioned, collected only in 57.2% of cases). Nevertheless, the observed AUC values of < 0.7 indicate limited discriminative performance and, therefore, limited clinical utility in their current form.
Table II
Probability of a “new” fragility fracture occurrence as assessed via the ROC curve
We next assessed the predictive value of skeletal factors on the basis of the ROC curve in women with osteopenia (n = 151). Unlike spine T-score, TBS demonstrated only limited discriminative ability, with an AUC of 0.512. However, the result was not significant, possibly due to the limited number of fractures in this group (n = 28).
As a final step, we sought to identify the most effective fracture prognostic model using FRAX as the base tool and adding additional factors (Table III). While the OR for the TBS factor alone was 0.05 (95% CI: 0.004–0.611), incorporating TBS into models including skeletal and clinical risk factors resulted in a significant improvement in its predictive value. Including TBS in the analysis of FRAX BMI, FRAX BMD or FRAX BMI + BMD spine increased the OR value for that factor in every case (respectively, 0.112, 0.291 and 0.172). We found that the OR for spine BMD (OR = 0.178; 95% CI: 0.031–1.003) after including it in the FRAX BMI + BMD spine + TBS diagnostic model increased significantly (OR = 0.466; 95% CI: 0.07–3.07).
Table III
Major osteoporotic fracture and hip fracture risk assessment using a non-linear logistic regression model using the FRAX algorithm and skeletal risk factors (BMD and TBS)
To sum up, all the analysed models (FRAX BMI + TBS, FRAX BMD + TBS, FRAX BMI + BMD spine + TBS) were statistically significant, which may suggest a potential role in clinical assessment, although their predictive performance remains limited and should be interpreted with caution. As regards the assessment of hip fracture risk, the OR values were notably lower for most parameters (except for FRAX BMI) in all analysed models. This may be related to the limited number of hip fractures reported in our study group. The lack of significance limits the ability to draw meaningful conclusions regarding hip fracture prediction in terms of using the evaluated models.
Discussion
Our findings indicate that the highest risk of fragility fractures was observed in individuals with confirmed osteoporosis accompanied by degraded bone microarchi-tecture (TBS < 1.23). Notably, the majority of patients with a history of osteoporotic fracture (n = 27), who had a T-score > –2.5, were simultaneously characterized by a TBS ≤ 1.31 (73% of the subgroup). However, it should be noted that the distribution of fractures across TBS and BMD categories did not reach statistical significance (p > 0.05). Therefore, these findings represent numerical differences that were not statistically significant. The observed pattern in the data may suggest that TBS has potential clinical relevance in identifying individuals at higher fracture risk, despite the absence of densitometric osteoporosis. Nevertheless, this observation should be interpreted cautiously and requires further confirmation (Fig. 2). Similar findings were reported by Lee et al. [23] in a study of 929 women (mean age 67.1 years), in which most fractures (n = 29; 31.5%) occurred in individuals with osteoporosis and low TBS. Notably, approximately a quarter of the fracture patients with degraded bone microarchitecture (12% degraded and 13% partially degraded) also had T-score above –2.5. In a study of 407 women, Therdyothin et al. [24] identified 115 fragility fractures. The majority of these fractures (n = 28; 24.3%) occurred in individuals with diagnosed osteoporosis (BMD spine) and low TBS. Consistent with previous observations, a substantial proportion of fractures (n = 27; 23.5%) was also reported in women with a non-osteoporotic T-score (> –2.5) and degraded microarchitecture (TBS ≤ 1.23). Del Rio et al. [13] focused on hip fractures in a cohort of 191 women aged ≥ 50 years, reporting 83 fracture incidents. Most hip fractures (n = 21; 25.3% of the fracture group) occurred in individuals with osteopenia and significantly degraded bone microarchitecture (≤ 1.23). Importantly, 45.8% of patients had at least partially degraded bone microarchitecture without densitometric evidence of osteoporosis.
Both scientific literature and our findings indicate that, although BMD is associated with fragility fracture risk, no clear T-score threshold can reliably identify individuals at negligible risk. This is supported by previous studies which showed a substantial proportion of fragility fractures in individuals without osteoporosis [25]. These observations emphasize the value of DXA-derived TBS as a complementary parameter in clinical practice, enabling the identification of individuals with impaired bone microarchitecture who are at increased fracture risk. This is particularly relevant given that TBS analysis does not require additional imaging and can be performed retrospectively using an existing spine BMD scan. This additional information may reduce the risk of under-treatment, especially among patients who do not meet the diagnostic criteria for osteoporosis but remain at increased fracture risk.
It is well established that reduced BMD is an independent fracture risk factor. However, as noted previously, the majority of fractures occur in individuals with a T-score higher than –2.5 [4, 22–24]. In our study, the predictive performance of BMD and TBS in fracture risk assessment was comparable, whereas the highest value (AUC 0.6; p < 0.05) was observed for FRAX-based models incorporating BMD and BMD combined with TBS. Although the inclusion of TBS in the FRAX BMD model improved its statistical performance, the overall prediction remained limited. The AUC values observed in our study (0.6) indicate only moderate predictive accuracy. These findings, while consistent with previously published large population-based cohort studies evaluating fracture prediction tools [11, 17], suggest that current models may not provide sufficient precision to support unequivocal clinical decision-making. These results confirm the relevance of the study approach; however, their clinical applicability remains limited. Similar observations have been reported by other authors, indicating that the combination of DXA-based skeletal parameters, including BMD and TBS, improves fracture risk prediction [26–28]. Nevertheless, the overall improvement in predictive performance remains modest.
A recent analysis of 71,209 individuals (89.8% women) demonstrated that the addition of TBS resulted in a small but statistically significant improvement in FRAX-based fracture prediction [17]. Similar findings were reported in the population-based Manitoba study (n = 29,407 postmenopausal women), in which comparable predictive probability was observed for spine BMD (AUC 0.64; 95% CI: 0.63–0.66) and TBS (AUC 0.63; 95% CI: 0.61–0.64). The combined model showed improved predictive accuracy (AUC 0.66; 95% CI: 0.65–0.68) [11]. Accordingly, Del Rio et al. [13] reported comparable results in the prediction of hip fractures (n = 191 women; mean age 66.8 years) for spine BMD (AUC 0.695; 95% CI: 0.625–0.76) and TBS (AUC 0.668; 95% CI: 0.597–0.734). The combined model incorporating both skeletal parameters demonstrated a higher AUC value (0.714; 95% CI: 0.645–0.77) compared to either predictor alone [13]. Su et al. [29] similarly emphasized the importance of supplementing BMD assessment (AUC 0.578; 95% CI: 0.543–0.613) with bone microarchitecture, as this approach improved the predictive performance of their models (AUC 0.581; 95% CI: 0.55–0.612). In a study by Popp et al. [30] (556 women; mean age 76.1 years), TBS demonstrated higher predictive value (AUC 0.69; 95% CI: 0.62–0.77) than BMD (AUC 0.62; 95% CI: 0.55–0.7). Consistent with previous findings, combining both parameters increased the model AUC value (0.71; 95% CI: 0.64–0.79). Similar results were reported by Vasic et al. [31], where bone microarchitecture assessment (AUC 0.663; 95% CI: 0.633–0.692) showed slightly higher predictive performance than BMD (AUC 0.646; 95% CI: 0.616–0.675) and provided additional predictive value when incorporated into a combined model (AUC 0.681; 95% CI: 0.652–0.71). Overall, these findings are consistent with existing scientific literature, indicating that indirect bone structure assessment using DXA-derived TBS predicts fracture risk independently and with comparable (if not superior) performance to BMD [11, 13, 17, 30, 31]. Importantly, the combination of these parameters is likely to improve fracture risk prediction in postmenopausal women.
As BMD alone proved to be only partially effective in predicting fracture occurrence, we aimed to identify the most effective model for fracture risk assessment. In our study, we found that models incorporating more comprehensive assessment approaches (such as FRAX BMD + TBS, FRAX BMI + TBS and FRAX BMI + BMD spine + TBS) increase the potential predictive value of skeletal parameters in the assessment of MOF. Del Rio et al. [13] reported an OR of 1.86 (95% CI: 1.29–2.68) for BMD spine and 1.66 (95% CI: 1.15–2.4) for TBS. The combined model demonstrated a substantial increase in predictive performance (2.39; 95% CI: 1.70–3.37), corresponding to a 55–74% improvement. A similar enhancement in predictive value (35–43%) was reported in group of 1,031 women for a model combining BMD and TBS (OR = 1.93; 95% CI: 1.67–2.23). When analysed separately, both parameters showed weaker associations with fracture risk (BMD OR = 1.50; 95% CI: 1.27–1.77 vs. TBS OR = 1.58; 95% CI: 1.32–1.78) [31]. Skeletal parameters were evaluated in the vertebral fracture assessment (n = 441 women) in a study by Rabier et al. [14] TBS was associated with an OR of 3.2 (95% CI: 2.01–5.08) per 1 SD, compared with 1.9 (95% CI: 1.34–2.84) for lumbar spine BMD. When the parameters were included in a combined model, predictive performance significantly increased (OR = 3.62; 95% CI: 2.32–5.65). Borgen et al. [32] (n = 496 women; mean age 65.6 years) reported that models with skeletal parameters may be significantly improved by adjustment for clinical risk factors (such as age, BMI, and fracture history). Odds ratio values for BMD and TBS analysed independently were 0.7 (95% CI: 0.56–0.87) and 0.73 (95% CI: 0.59–0.9), respectively. After including these risk factors, model performance improved modestly, with OR increasing to O.75 (95% CI: 0.6–0.95; p = 0.017) for BMD and 0.81 (95% CI: 0.64–1.03; p = 0.084) for TBS [32]. In a study involving 2,165 women aged over 40 years, both BMD (OR = 1.24; 95% CI: 1.09–1.4) and TBS (OR = 1.38; 95% CI: 1.22–1.56) demonstrated predictive value when analysed separately. When a combined model including both parameters and age was applied, predictive performance remained unchanged (OR = 1.38; 95% CI: 1.23–1.55) but statistically significant. Notably, BMD was not statistically significant within the combined model (OR = 1.12; 95% CI: 0.98–1.28) [33]. Our findings in the Polish population are generally consistent with those reported in the literature, indicating that fracture risk assessment models may gain additional prognostic value with the inclusion of complementary parameters. The use of multidimensional assessment approaches may allow for more accurate fracture risk assessment and facilitate the identification of patients requiring appropriate treatment.
Study limitations
Considering the observed treatment gap and epidemiological characteristics of low-energy fractures in Poland, population-specific validation of combined diagnostic models appears particularly important. While the present analysis is based on a regional cohort, the methodological framework and observed relationships may be informative for other populations in which FRAX calibration, treatment gaps and access to TBS are comparable. However, despite our efforts, this study has several limitations, including the lack of systematic follow-up assessment that would allow for a more precise evaluation of fracture timing. The analytic cohort (n = 411 out of 5,000 screened DXA records) reflects a predefined eligibility process prioritizing data completeness, DXA technical quality (for valid TBS re-analysis), and the feasibility of a long-term follow-up. While this multistep inclusion process may limit a full representativeness assessment against all screened records, the exclusions were predominantly technical rather than clinical. The cohort also yielded 96 incident fractures, meeting conventional events-per-variable criteria and supporting the adequacy of the statistical analyses. Therefore, the risk of substantial overfitting due to an insufficient number of outcome events is likely low. Nevertheless, as all participants were women referred for osteoporosis screening, the generalizability of these findings may be limited. Another limitation is the potential recall bias associated with telephone-based follow-up. As fracture events were self-reported several years after their occurrence, some degree of misclassification, particularly regarding the exact timing or mechanism of injury, cannot be excluded. Efforts were made to ensure data completeness; however, as with all questionnaire-based studies, certain limitations remain. In cases of missing data, additional information was collected during the follow-up assessment.
Questionnaires with substantial missing data were excluded at the initial stage of the study.
Approximately half of the participants were missing hip BMD results, as this was not an inclusion criterion (given that TBS requires only spine DXA). This distribution reflects routine clinical practice, where lumbar spine DXA is typically the initial diagnostic test, and hip DXA is obtained selectively based on clinical indications. However, this limitation may have weakened the predictive performance of hip BMD FRAX and combined BMD-TBS models. Therefore, these findings should be interpreted with caution. To the best of our knowledge, the limited availability of hip BMD measurements was a likely contributor to the weaker performance of the hip fracture prediction analyses. Another limitation is the lack of detailed information on previous antiresorptive treatment. Although slightly more than half of the osteoporotic patients reported prior therapy, the absence of standardized data on adherence and treatment duration limits the ability to quantify its impact on fracture risk. This may have partially influenced fracture risk estimates in this subgroup. The present results suggest that studies evaluating the predictive value of combined diagnostic models have potential. However, despite achieving statistical significance, AUC values below 0.7 indicate only moderate discriminatory ability. Therefore, the predictive performance of these models remains limited and should be interpreted with caution. Further studies are required, particularly focusing on patients with osteopenia and their medical history. The relatively small number of fractures observed in the osteopenia subgroup (n = 28) substantially reduces the statistical power of the fracture prediction analysis and limits the interpretability of TBS performance in this population.
Conclusions
Indirect bone microarchitecture assessment using DXA-derived TBS predicts fragility fracture risk independently of spine BMD, with comparable predictive performance in postmenopausal women in Poland. However, TBS demonstrated only moderate fracture prediction, and its performance was not statistically significant in the osteopenia subgroup (likely due to the limited number of fractures). The use of combined models, including parameters such as FRAX, BMD and TBS, may improve fracture risk prediction, particularly for MOF. DXA-derived TBS may provide complementary information to BMD or FRAX in fracture risk assessment among Polish postmenopausal women. Further studies are required to evaluate fracture prediction models in patients with osteopenia.