
Introduction
Osteoporosis and metabolic syndrome (MetS) are two prevalent conditions with similar pathogenic patterns [1]. In recent decades, an increase of osteoporosis and cardiometabolic syndrome prevalence has been observed [2, 3]. The relationship between these disorders has been a matter of extensive clinical research and investigation, with conflicting results. It is known that MetS is characterized by a combination of obesity, dyslipidaemia, hyperglycemia, and hypertension [4].
Metabolic syndrome includes serious cardiovascular risk factors that confer a high risk of morbidity and mortality [4]. Moreover, in old age, with the occurrence of fractures, osteoporosis constitutes a major health problem [3]. Common pathogenic links have been recently proposed between these two conditions [1].
Bone metabolism, through independent mechanisms, may be affected by MetS components. By inducing inflammation and increasing calcium excretion, MetS can contribute to reduced bone density [5]. On the other hand, obesity may protect against osteoporosis by increasing mechanical loading on the bones. It has been demonstrated that adipose tissue is an endocrine organ; by secreting biological active substances, it may positively influence bone mineral density (BMD) [6–8]. However, studies focusing on the association between MetS and osteoporosis provide disharmonious results. This incoherence can be explained by the balance between beneficial effects of visceral obesity expressed by increased waist circumference versus the detrimental impact of the other components of bone density.
Considering the increasing prevalence of MetS and osteoporosis and the uncertainty regarding their association and the lack of relevant information in Morocco, our aim was to determine the prevalence of MetS in postmenopausal Moroccan women with osteoporosis and to examine the relationship between the individual components of the MetS and bone metabolism in this population.
Material and methods
We enrolled 100 postmenopausal women with osteoporosis for this cross-sectional study after excluding participants with hyperthyroidism, hyperparathyroidism, bone metastases, osteomalacia, Paget disease, autoimmune disease, multiple myeloma, renal failure and congenital disease of bone formation.
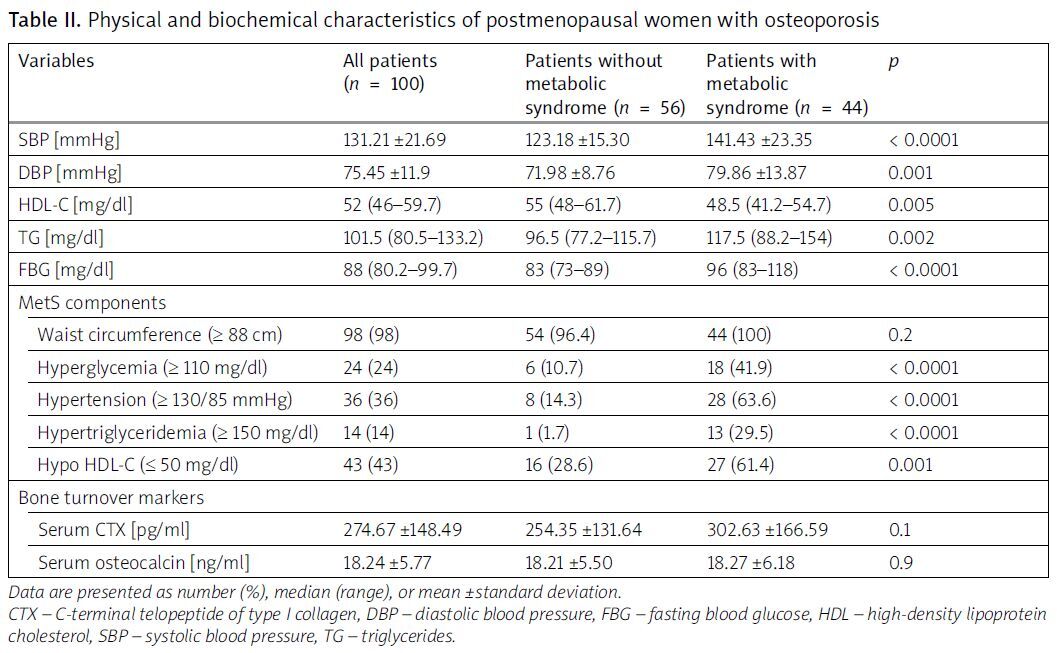
Metabolic syndrome was defined by National Cholesterol Education Program-Adult Treatment Panel III criteria [4]. Metabolic syndrome was retained if 3 or more of the following elements were confirmed: waist circumference ≥ 80 cm, high blood pressure [systolic blood pressure (SBP) ≥ 130 mmHg or diastolic blood pressure (DBP) ≥ 85 mmHg] or hypertension history, high-density lipoprotein cholesterol (HDL-C) < 50 mg/dl, triglycerides (TG) ≥ 150 mg/dl, fasting plasma glucose (FPG) ≥ 100 mg/dl or a history of diabetes mellitus.
Bone mineral density was measured at the lumbar spine in region L1–L4 and the femoral neck using dual-energy X-ray absorptiometry (Lunar Prodigy vision; GE Healthcare, Madison, WI, USA). Bone density was expressed in absolute BMD values (g/cm2) and T-scores. Osteoporosis was defined using the World Health Organization (WHO) classification system as T-score ≤ –2.5 standard deviation (SD) of either the lumbar spine or femoral neck with the application of the Moroccan female normative data [9, 10]. All our patients had osteoporosis with a T-score ≤ –2.5 SD.
Other information, including age, educational level (illiterate, primary, secondary, university level), occupation (employed, housewife), matrimonial status (married, divorced, single, widowed), physical activity (all movements produced by the musculoskeletal system with energy consumption including leisure time, work, and domestic activities [yes/no]), monthly household income (less than € 250, € 250–300, more than € 300 €) history of diabetes and hypertension, was also assessed. The body mass index (BMI) was obtained by dividing weight [kg] by height [m2]. Waist circumferences were measured in the horizontal plane midway between the lowest rib and iliac crest. The following blood test results were also recorded for each participant: FPG, TG, HDL-C, and bone turnover markers – carboxy-terminal cross-linked telopeptide of type I collagen (CTx) [pg/ml] and osteocalcin [ng/ml].
Statistical analysis
SPSS Statistics for Windows version 20.0 (IBM, NY, USA) was used to perform statistical calculations. Data are presented using frequencies and percentages for categorical variables and range, mean, and standard deviation for interval variables. The χ2 test was used to analyze categorical data. The independent Student’s t test or Mann-Whitney U test was performed to compare continuous variables. Correlations were assessed using Spearman’s rank correlation coefficient (R). The Kolmogorov-Smirnov test was used to analyze data distribution. The relationships between MetS components and BMD features were analyzed using multiple linear regressions. A p-value < 0.05 was considered statistically significant.
Bioethical standards
In accordance with the ethical standards laid down in the 1964 Declaration of Helsinki and its later amendments, the Ethics Committee of Medical University of Rabat approved the study protocol in 2017 (26.09.2017) [11]. Informed consent was obtained from all participants.
Results
Of the patients, 44% were diagnosed with MetS. Most of the patients were overweight; the mean BMI was 27.33 ±3.86. There was no history of smoking or alcohol consumption in any of the patients. The average T-score was –3.1 (from –3.6 to –2.7) for lumbar spine and –1.6 (from –2.1 to –1.1) for femoral neck. The mean age of patients with and those without MetS was 63.82 ±8.65 and 60.39 ±7.93, respectively; p = 0.04 (Table I). There was no significant difference between the 2 groups regarding BMI, BMD parameters (Table I), and bone turnover markers (Table II). Lumbar spine BMD correlated significantly with HDL-C (r = –0.233; p = 0.02). Lumbar spine T-score correlated significantly with SBP (r = –0.196; p = 0.005) and waist circumference (r = 0.274; p = 0.006). Femoral neck T-score correlated with DBP (r = –0.218; p = 0.02) and waist circumference (r = 0.294; p = 0.003; Table III). Osteocalcin inversely correlated with HDL-C and FPG (r = –0.199; p = 0.04 and r = –0.238; p = 0.01, respectively; Table III). C-Terminal telopeptide of type I collagen negatively correlated with HDL-C and SBP (r = –0.238; p = 0.02 and r = –0.243; p = 0.01 respectively; Table III). In linear regression, lumbar spine BMD was significantly associated with age (β = –2.120, p = 0.04), SBP (β = –0.112, p = 0.01), and waist circumference (β = 0.253, p = 0.001; Table IV). Femoral neck BMD was significantly associated with age (β = –0.227, p = 0.02) and waist circumference (β = 0.258, p = 0.008). Femoral neck T-score was negatively associated with DBP (–0.245, p = 0.02; Table IV). No association was found between HDL-C, TG, and BMD. Glycemia (β = –0.245, p = 0.03) and SBP (β = –0.323, p = 0.01) remain the significant MetS components influencing osteocalcin and CTx, respectively (Table IV).
Table I
Socio-demographic variables of patients and osteoporosis features
Table II
Physical and biochemical characteristics of postmenopausal women with osteoporosis
Table III
Univariate analysis of the relationship between metabolic syndrome components and bone mineral density and turnover markers in postmenopausal women with osteoporosis
Table IV
Multivariate linear regression with bone mineral density and turnover markers as dependent variables and metabolic syndrome risk factors as independent variables
[i] BMD – bone mineral density, CI – confidence interval, CTX – carboxy-terminal telopeptide of type I collagen, DBP – diastolic blood pressure, FBG – fasting blood glucose, HDL-C – high-density lipoprotein cholesterol, MetS – metabolic syndrome, SBP – systolic blood pressure, SE – standard error, TG – triglycerides.
Discussion
The prevalence of MetS in postmenopausal women with osteoporosis in our study was found to be 44%. Age, blood pressure, and waist circumference were significantly associated with BMD. To our knowledge, although there are numerous studies that define the prevalence of MetS in menopausal transition and postmenopausal women, there is a lack, both nationally and internationally, of studies focusing on the prevalence of MetS in postmenopausal women with osteoporosis. Of the patients, 25% of the global population is affected by MetS, highlighting its important public health challenge, especially in elderly patients with fragility fracture risk [2]. Metabolic syndrome has a higher prevalence in postmenopausal Moroccan women (34.9%) than that reported for the general population (26.3%) [12]. An elevated prevalence of MetS estimated at 74.18% was reported in a recent study, in a sample of postmenopausal Moroccan women [13]. Metabolic syndrome prevalence is considerably high in menopausal transition (62.59%) [14]. Moreover, MetS is more prevalent in elderly women and can reach 64.4% [15]. In Mexican postmenopausal women, the prevalence of MetS was 57.2% [16]. In elderly Taiwanese, 33.0% of participants with osteoporosis had MetS [17]. The prevalence of MetS was 48.5% in Korean postmenopausal women [6]. The difference in prevalence can be explained by variety in lifestyle, diet, and social habits and behavior, which can be associated with an increased prevalence of metabolic syndrome, making it a public health problem and a major risk for cardiovascular diseases [2, 3]. In our study, older age was associated with MetS and increased bone loss. In postmenopausal women, the decrease in estrogen level leads to altered body composition and fat distribution, with reduced muscle mass and bone mass. These modifications are associated with the development of MetS. Metabolic syndrome risk factors are diverse and include dyslipidemia, insulin resistance, abdominal obesity, and elevated blood pressure in a pro-inflammatory state [11]. In our Moroccan context, poor dietary habits (higher carbohydrate intake, poorly planned vegetarian diet, low intake of calcium), sedentary lifestyle, and lack of physical activity lead to metabolic disorders. Moreover, aging, health behaviors (smoking, alcohol intake, nutrient deficiency, low physical activity), clothing habits, as well as endocrine and genetic factors aggravate MetS and induce bone mass decrease. Considering all these risk factors, aging patients may suffer from concomitant MetS and osteoporosis [18].
The present study results of the positive association of MetS with BMD seem to be driven by the component of visceral obesity. Edelstein et al. observed that all BMD sites showed a favorable association with abdominal obesity [19]. The association between MetS and bone density in our study aligns with previous findings. We found that waist circumference was positively associated with BMD, which reflects the effects of mechanical loading on the skeletal system. Kim and Kim [6] and Fodor et al. [8] found that osteoporosis risk was lower with higher waist circumference and that significant abdominal fat was associated with increased bone density. El Maghraoui et al. [15] and Chin et al. [20] reported that women with MetS had higher BMD. Also, MetS was found to have a beneficial influence on BMD of the spine in the meta-analysis of Xue et al. [21]. In older people, obesity is commonly perceived as a protective element against bone mass decrease. Studies have suggested that in spite of increasing risk of other metabolic chronic disorders, obesity, through improving the mechanical loading on bones, boosts the bone metabolism [22]. Obesity is also associated with hyperinsulinemia which leads to increased bone formation. Furthermore, in obese individuals, estrogen is synthesized in adipocytes. Adipocytes enhance BMD by converting androgens to 17β-estradiol, the most potent estrogen [23]. Likewise, Prestwood et al. [24] demonstrated that low-dose 17β-estradiol medication increased hip, spine, and wrist BMD and also reduced turnover markers of aged women (> 65 years). However, other contradictory results exist. Von Muhlen et al. [5] observed that MetS was linked to lower BMD. Moreover, Lin et al. [15] reported that MetS was not associated with higher BMD in Taiwanese women. Similar results were reported by Terzi et al. [25]. Furthermore, MetS was not associated with reduced osteoporosis risk in women, in a recent meta-analysis and systematic review [26]. Likewise, Salas et al. [16] reported that MetS components were associated with bone loss and increased osteopenia or osteoporosis risk. Later investigations revealed that excess visceral fat mass due to obesity increases osteoporosis risk [27]. Adipocyte hypertrophy and hyperplasia enhance the adipose tissue growth and lead consequently to obesity. Adipocytes and osteoblasts result both from the differentiation of the multipotent mesenchymal stem cells in the marrow, the common progenitor for fat and bone cells. Various signaling pathways modulate the balance of adipocyte and osteoblast differentiation. In addition to energy storage, adipose tissue is a source of pro-inflammatory cytokines such as tumor necrosis factor and interleukin. Osteoclast differentiation and bone resorption are induced through the activation of receptor activator of NF-κB ligand (RANKL)/receptor activator of NF-κB (RANK)/osteoprotegerin pathway. Some studies suggest that minor chronic inflammation adversely impacts bone strength [27]. Even if notable bone health and density are associated with obesity, its unfavorable effects on bone quality may damage bone health [28]. Nevertheless, adverse effects of obesity on bone structure and function occurring in early age may persist into older age. It has been suggested that insulin resistance and inflammation, considered as common obesity metabolic complications, are associated with impaired metabolic health and poor BMD [28]. Regardless of associated higher BMD and obesity, patients with type 2 diabetes have increased fracture risk [29]. However, lifestyle factors or differentiation of stem cells towards adipocytes at the expense of osteoblasts, due to poor metabolic health, may lead to visceral fat accumulation and bone structure and function decline [28, 29]. In addition, the fracture risk associated with visceral adiposity has not been examined [29]. This paradoxical relationship between obesity and bone mass may be interpreted by the various actions of obesity on bones [22]. In fact, central obesity, as a component of MetS reflected by higher waist circumference, is associated with significant 17β-estradiol levels, which may inhibit bone resorption and stimulate bone formation. In parallel, visceral fat as an origin of pro-inflammatory mediators may lead to lower BMD [22].
Among MetS components, SBP and DBP correlated negatively with BMD. Similarly to our findings, hypertension increases the risk of lower BMD [1]. However, the effect of increased blood pressure on bone health is a controversial issue with contradictory reports. In a recent systematic review and meta-analysis [30], blood pressure augmented osteoporosis risk by enhancing calcium excretion, elevating parathyroid hormone level and consequently increasing bone resorption [31]. In the findings of Kaplan et al. [32], no relationship was established between blood pressure and BMD in postmenopausal women. Contradictorily, SBP correlated positively with total hip BMD in the report of Chin et al. [20]. It has been suggested that the positive association with BMD and increased SBP is attributable to increased peripheral vascular resistance due to increased body size [20, 31].
We found in the univariate model that higher HDL-C level was associated with a higher spine BMD, which could be mediated by sex hormones, responsible for lipid regulation and bone formation. A protective effect of bone health by HDL-C was suggested. Oxidized low-density lipoprotein cholesterol (LDL-C) can induce osteoblast apoptosis and increase osteoclast survival, and HDL-C can inhibit LDL-C oxidation [33]. Similarly, Muka et al. [34] and Jeon et al. [35] found that HDL-C was positively associated with lumbar spine BMD in postmenopausal women. However, an inverse association between HDL-C and BMD was reported in postmenopausal Korean women [36].
Other components of MetS, such as fasting blood glucose and TG levels, were not associated with BMD in this study. Similar findings were reported by Chin et al. [20].
However, a positive relationship between BMD and TG in women was reported. Triglycerides increase body weight by being stored in adipocytes and are implicated in bone metabolism by being transported by apolipoprotein E [37].
Given this controversy in the relationship between components of MetS and BMD, we focused on analyzing the circulating bone turnover markers (C-terminal telopeptide of type I collagen, a bone-resorption marker [CTX] and osteocalcin) to determine possible associations with MetS components. We used the reference markers of bone turnover, especially osteocalcin secreted by osteoblasts and CTX, which is released by osteoclasts [38]. In our study, osteocalcin inversely correlated with HDL-C and FPG, whereas CTX negatively correlated with HDL-C and SBP. Osteocalcin level was lower in patients with impaired fasting glucose, which supports other authors’ findings [39]. Significantly, osteocalcin and CTX were lower in metabolic syndrome patients in the report of Terzi et al. [25], and lower osteocalcin levels in obese women with impaired fasting glucose levels were reported by García-Martín et al. [40].
Osteocalcin is implicated in calcium homeostasis, bone mineralization, glucose, and fat regulation [41]. Osteocalcin enhances skeletal muscle and adipocyte sensitivity to insulin, consequently abrogating the deleterious effects of a high fat diet on bone metabolism and improving glucose metabolism. Consequently, to predict the increased diabetes risk in postmenopausal women, the authors suggested a potential utility of osteocalcin dosage [41].
The decrease in CTX-1 in patients with MetS was associated with dyslipidemia and systemic inflammation [41]. Interestingly, the data on the influence of MetS in bone turnover markers are also conflicting [8, 42]. In other research, bone turnover markers were not significantly influenced by any of the MetS components [8].
Study limitations
However, some limitations of our study must be addressed. Firstly, we assessed BMD in two bone sites, but the relationship between MetS and BMD might differ at other sites. Secondly, regarding the observational nature of the study, a cause and effect relationship between MetS and BMD cannot be established. Thirdly, our selected patients were ambulatory and volunteers, which may affect the Moroccan population representation. Nevertheless, our patients come from many regions of Morocco, so they can be considered a relatively representative sample of Moroccan women. A comprehensive determination of dietary intake (calcium, vitamin D) and the dosage of 25 (OH) vitamin D3 and C-reactive protein levels was not performed. Also, pro-inflammatory cytokines, adipokines, sex hormones, as well as bone geometry and structure, were not evaluated. Therefore, further pathophysiological investigations are required to confirm our results.
Conclusions
The study highlights the prevalence of MetS in postmenopausal women in Morocco, as a middle-income developing country, and suggests a positive association between MetS and BMD, prominently due to abdominal obesity. Waist circumference was the most predominant MetS component related to increased BMD. Abdominal obesity, reflected by waist circumference, is associated with significant estrogen levels, reputed to be a bone remodeling inhibitor. In parallel, visceral fat as an origin of pro-inflammatory mediators may lead to lower BMD. Lifestyle, diet, and social habits and behavior should be considered in analyzing the association between MetS and bone mass. The development of therapeutic interventions for both diseases must be preceded by a better understanding of the association between MetS and osteoporosis. Consequently, the effect of intentional weight loss on bone density and quality must be examined. Further studies using carefully designed in vivo animal models mimicking a MetS-inducing diet are required to clarify the association between visceral fat, bone density and strength, and fracture risk.