
Introduction
Rheumatoid arthritis (RA) is one of the most common inflammatory arthropathies all over the world. It runs a chronic course and is characterized by the presence of synovitis resulting in symmetric polyarthritis with progressive destruction of joints and resultant deformity in the absence of early treatment intervention. It frequently involves extra-articular connective tissues indicating the systemic inflammatory response [1].
The distribution of the disease is worldwide with no race predilection. It preferably affects women with a sex ratio of 2–4 : 1 as with other autoimmune diseases [2].
Rheumatoid arthritis prevalence increases with age and the sex difference decreases with advancing age. The majority of epidemiological data are from developed countries’ populations, where the prevalence is 0.5–1.1% [3]. In developing countries, the prevalence is low (0.01–0.5%) and there is extremely low presence in some areas of rural Africa. A higher prevalence is seen in certain Native Americans, suggesting the influence of genetics on disease risk. The worldwide incidence of RA ranges from 0.01% in France to 0.3% in Asia [4]. The age-standardized incidence rates are increasing overall in the world.
Increasing public awareness about the disease, its risk factors, and the outcome of diagnosis at an early stage and managing with disease-modifying antirheumatic drugs (DMARDs) are appropriate to reduce health care expenditure, disease burden, associated morbidity, and mortality [5].
Rheumatoid arthritis is diagnosed on the basis of the number of joints involved with joint swelling and tenderness accompanied by morning stiffness, presence of autoantibodies such as rheumatoid factor (RF), anti-cyclic citrullinated peptide (ACPA) antibody and rheumatoid nodules, and radiographic changes of joints [6]. Hematologic parameters which are routinely measured are important in the assessment of many diseases. Inflammation leads to changes in the expression of the immune system and its elements such as neutrophils, lymphocytes, and platelets, which have a key role in the regulation of inflammation.
Red cell distribution width (RDW) is a variation of red blood cell (RBC) size [7]. High RDW is a marker of RA and other rheumatologic diseases. It is calculated as the standard deviation of the percentage of RBCs from mean corpuscular volume (MCV). It is a marker of lower hemoglobin concentration and also helps in differentiating the type of anemia. It is influenced by anemia and inflammation; however, the influence of anemia on RDW is stronger [8].
Research work has highlighted the importance of RDW and its association with the level of inflammation in inflammatory diseases [9]. In RA patients, a correlation has been found between RDW and acute phase reactants such as erythrocyte sedimentation rate (ESR) and C-reactive protein (CRP) [10].
The neutrophil-lymphocyte ratio (NLR) has been evaluated as a marker of inflammation in a number of studies involving cardiovascular diseases, malignancy, and autoimmune diseases such as ulcerative colitis and systemic lupus erythematosus [11]. We studied whether RDW and NLR indicate inflammation in RA and whether they have a correlation with disease activity parameters.
Material and methods
This cross-sectional observational study was conducted in the Department of General Medicine, Himalayan Institute of Medical Sciences, Dehradun, India from July 2020 to December 2021 on 100 patients with RA. Approval was obtained from the institutional ethics committee dated 21 November 2019 (SRHU/HIMS/ETHICS/ 2021/125). The study was conducted in accordance with the principles of the Declaration of Helsinki (as revised in Brazil, 2013) and after obtaining written informed consent from the patients.
Patients above 18 years of age and diagnosed as having RA according to the 2010 American College of Rheumatology (ACR)/European Alliance of Associations for Rheumatology (EULAR) classification criteria were enrolled in this study. A score of ≥ 6 fulfilled the requirements for definite RA.
We excluded patients with a known myeloproliferative disorder, diabetes mellitus, chronic kidney disease, chronic liver disease, systemic infections, overlapping connective tissue diseases, a recent history of blood transfusion, and who were on COX-2 inhibitor drugs.
Demographic data, history, clinical examination, and detailed musculoskeletal examination were recorded in the case recording form. The severity of RA was assessed by the EULAR Disease Activity Score with 28-joint counts and ESR (DAS28–ESR).
The 28 joints comprised the first two interphalangeal joints, eight proximal interphalangeal joints, ten metacarpophalangeal joints, two wrist joints, two shoulder joints, and two knee joints. Estimation was based on counting the number of swollen joints (SJC) and the number of tender joints (TJC) out of a total of 28 joints, ESR value, and the patient’s assessment of general health (GH) or global disease activity on a 100 mm Visual Analogue Scale (VAS) [12].
DAS28–ESR was calculated using the formula DAS28–ESR = 0.56×√ (TJC-28) + 0.28× √ (SJC-28) + 0.014 × GH + 0.70 × ln(ESR) [13]. A DAS28–ESR score of less than 2.6 was considered as remission, 2.6 to 3.1 as low disease activity, 3.2 to 5.1 as moderate disease activity, and more than 5.1 as high disease activity.
Laboratory indices such as RDW and NLR (obtained by dividing the neutrophil count by the lymphocyte count) along with other indices as mentioned were recorded and analyzed. Baseline investigations included complete hemogram (CH), serum CRP, rheumatoid factor (RF), ACPA, ESR, urine analysis, fasting blood sugar, liver function tests, blood urea nitrogen, serum creatinine, uric acid, anti-nuclear antibodies (ANA) and other required tests.
Statistical analysis
Results were analyzed by SPSS Statistics version 22. Sensitivity, specificity, positive predictive value, and negative predictive value were calculated for RDW and NLR considering DAS28–ESR as the gold standard. The correlation between different variables was estimated by the Pearson product-moment correlation coefficient. Multivariate analysis was done by multiple linear regression for testing the independent association between various variables. The receiver operating characteristic (ROC) curve was utilized to determine the discriminatory power of NLR and RDW using DAS28–ESR as a standard. A p-value < 0.05 was taken as statistically significant.
Results
The baseline characteristics of patients with RA are shown in Table I. Male : female ratio was 1 : 4.26. The majority (61%) of patients were above 50 years of age. Out of 100 patients, 9% were smokers and 4% were habituated to alcohol. The majority (93%) of patients had RA for more than 1 year.
Table I
Baseline characteristics of patients with rheumatoid arthritis (n =100)
Joint tenderness was the most common (85%) finding among patients with RA. Joint deformities were seen in more than one-third (37%) of the patients. The majority (91%) of patients were taking more than one DMARD. Comorbidities were seen in 33% of patients; osteoporosis (10%) and spondylosis (11%) were the most common comorbidities. The majority (51%) of patients showed mild disease activity. The mean NLR in patients with RA was 3.88 ±2.59. The mean RDW in patients with RA was 16.25 ±2.49% (Table II).
Table II
Clinical features of patients with rheumatoid arthritis (n = 100)
[i] ACPA – anti-cyclic citrullinated peptide antibodies, ANA – antinuclear antibody, CRP – C-reactive protein, DAS28–ESR – Disease Activity Score with 28-joint counts and ESR, DMARD – disease-modifying antirheumatic drug, ESR – erythrocyte sedimentation rate, FFD –fixed flexion deformity, NLR – neutrophil-lymphocyte ratio, RDW – red cell distribution width, RF – rheumatoid factor.
Among the patients with RA, NLR had a significant positive correlation with ESR (r = 0.223, p = 0.026) and VAS (r = 0.248, p = 0.013) and a negative correlation with osteoporosis (r = –0.244, p = 0.014) and radiographic bone erosions (r = –0.460, p = 0.048). A highly significant positive correlation was seen between NLR and RDW (r = 0.260, p = 0.009). No significant correlation was seen between NLR and disease duration, TJC, SJC, CRP, RF, ACPA, and DAS28–ESR (Table III).
Table III
Correlation of disease-related parameters with NLR of patients with rheumatoid arthritis
[i] ACPA – anti-cyclic citrullinated peptide antibodies, CI – confidence interval, CRP – C-reactive protein, DAS28–ESR – Disease Activity Score with 28-joint counts and ESR, ESR – erythrocyte sedimentation rate, NLR – neutrophil-lymphocyte ratio, RDW – red cell distribution width, RF – rheumatoid factor, VAS – Visual Analogue Scale.
Red cell distribution width did not show a significant correlation with disease duration, TJC, SJC, VAS, DAS28–ESR, CRP, RF, ACPA, ESR, osteoporosis, and radiographic bone erosions (Table IV).
Table IV
Correlation of disease-related parameters with RDW of patients with rheumatoid arthritis
[i] ACPA – anti-cyclic citrullinated peptide antibodies, CI – confidence interval, CRP – C-reactive protein, DAS28–ESR – Disease Activity Score with 28-joint counts and ESR, ESR – erythrocyte sedimentation rate, NLR – neutrophil-lymphocyte ratio, RDW – red cell distribution width, RF – rheumatoid factor, VAS – Visual Analogue Scale.
Red cell distribution width, ESR, VAS, radiographic bone erosions, and osteoporosis did not show an independent association with NLR (Table V).
Table V
Multiple linear regression analysis showing disease-related parameters having independent association with NLR in patients with rheumatoid arthritis
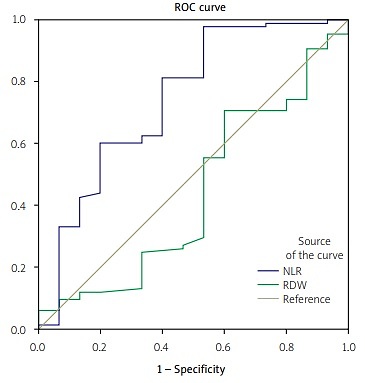
The diagnostic value of NLR and RDW for disease activity in patients with RA was compared using the ROC curve (Fig. 1).
Fig. 1
Receiver operating characteristic curve of neutrophil-lymphocyte ratio (NLR) and red cell distribution width (RDW) as inflammatory markers in rheumatoid arthritis (RA).
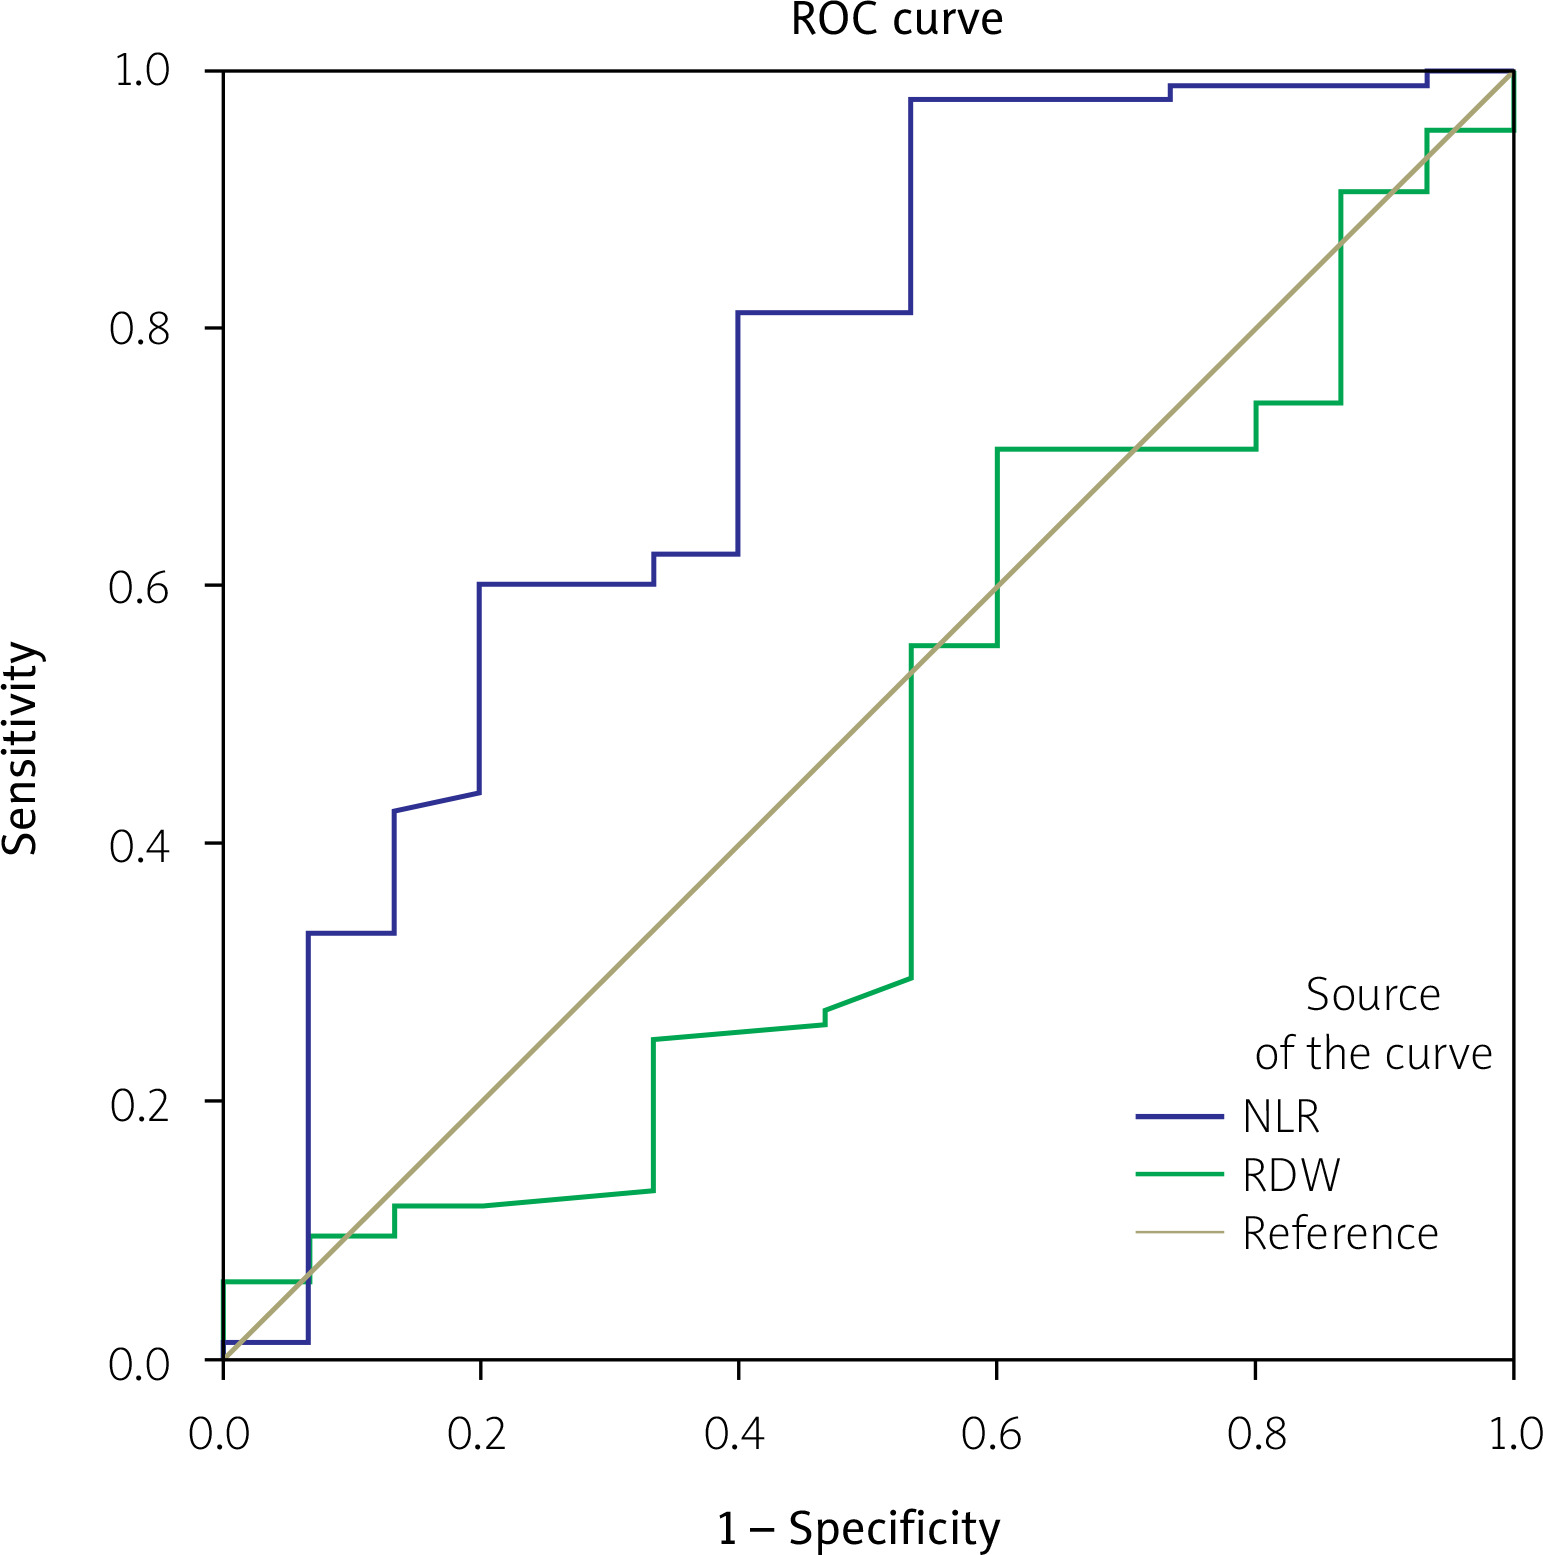
The analysis of the ROC curve showed that NLR was still the best indicator for the laboratory diagnosis of disease activity in RA with an area under the curve (AUC) of 0.78 (p = 0.001, 95% CI: 0.69–0.86, Youden index 0.47), and at a cut-off value of 1.63, the diagnostic sensitivity was 97.7% and specificity 50%. For RDW, AUC was 0.43 (p = 0.40, 95% CI: 0.35 to 0.50, Youden index 0.33), and at a cut-off value of 14.52, the diagnostic sensitivity was 70.5% and specificity 41.7%.
The sensitivity and specificity of NLR were higher than those of RDW. The difference between the AUC of NLR and RDW was 0.35 (p = 0.02). Neutrophil-lymphocyte ratio had a positive predictive value of 93.3% and a negative predictive value of 20% for disease activity.
Red cell distribution width had a positive predictive value of 90% and a negative predictive value of 16.7% for disease activity.
Discussion
A dysregulated immune system and persistent inflammation are conspicuous in chronic inflammatory disorders and have an adverse effect on the hematopoietic system. Changes in the components of the peripheral blood cells could imply disease activity in patients with RA [14].
In chronic systemic inflammatory disorders, changes in blood cell components could be attributed to various immune and non-immune mediated mechanisms. These changes could include abundant production of cytokines, antibodies, immune complexes, deficiency of growth factor, decrease in life span, deficient neutrophil functions, gastrointestinal loss, and medication-related toxicity [15].
We observed that female patients with RA accounted for 81% of the patients. A greater number (61%) of patients were above 50 years of age. Our findings are in accordance with the results of another study which included 21 (32%) males and 45 (68%) females with RA. Our patients with RA had a mean age of 52.54 ±10.1 years; RA patients having active disease had a mean age of 53.02 ±9.92 years while RA patients with inactive disease had a mean age of 49 ±11.14 years.
In another study, which recruited 511 patients with RA, the mean age was 59 years, which was slightly higher than that observed in our study. However, female dominance (73% females and 27% males) was seen in that study as in our study [16].
Most (91%) of our patients were on combination treatment with DMARDs, mainly hydroxychloroquine (86%) and methotrexate (80%), while the use of sulfasalazine and leflunomide was much lower. Biologics were taken by only 10% of our patients and adalimumab was the sole biologic used. A high number (70%) of patients were on glucocorticosteroids.
In another study [15], which was conducted to estimate the DAS28–CRP and DAS28–ESR value for remission and involved 6,729 patients with RA, patients receiving methotrexate (45.6%) and biologics (0.34%) were fewer than in our study.
In our study, the mean NLR was found to be 3.88 ±2.59 in patients with RA, 4.10 ±2.66 in the active group, and 2.28 ±1.02 in the inactive group. Similarly, another study observed mean NLR as 2.93 ±1.00 in patients with RA and 3.92 ±0.31 in patients with high-level disease activity [17]. Previous studies have noted significantly higher NLR values in patients with active disease compared to those with inactive disease, making it a good inflammatory marker for predicting active disease in RA [18].
The mechanism resulting in increased NLR remains to be elucidated. It is a complex interplay of various factors such as cytokines, chemokines, and interleukins. This culminates in neutrophilia and lymphopenia. Lymphopenia may also be exaggerated by the increased apoptosis [19].
In our study, mean RDW was found to be 16.25 ±2.49 in patients with RA, 16.24 ±2.57 in the active group, and 16.31 ±1.82 in the inactive group. Likewise, in another study, which included 124 patients with RA, the mean RDW was 15.2 ±2.9 in the active disease group and 14.6 ±2 in the inactive disease group [20].
Our study found a significant correlation between NLR and RDW, ESR, VAS, osteoporosis, and radiographic joint erosions. In another study, NLR had a significant correlation with health outcome measures such as Health Assessment Questionnaire (HAQ), SF-36, CRP, ESR, VAS, SJC-28, and DAS28–CRP. However, these correlations were not robust in the subgroup analysis [21]. In our study, subgroup analysis was not done. The neutrophil-lymphocyte ratio did not show a significant correlation with disease duration, TJC, SJC, DAS28–ESR, RF, ACPA, or CRP. The factors which led to poor correlation could be a significant decline in pro-inflammatory markers with a decline in the disease activity of RA.
The findings of a significant correlation between NLR and radiographic bone erosions are supported by findings of another cross-sectional study by Maatallah et al. [22] which included 53 patients with RA and measured inflammatory markers including NLR. The modified Sharp score along with its components (erosion score and joint space narrowing score) were assessed using X-rays of the hands and feet. The mean DAS28–ESR was 4.64 ±1.23. Scores exceeding 3.2 (denoting moderate or severe disease function) were present in 43 patients. The mean joint erosion and joint space narrowing scores were 12.76 ±15.05 and 33.57 ±25.80 respectively with the mean modified Sharp score of 46.33 ±37.74. A positive correlation was present between the modified Sharp score and NLR (p = 0.031). Moreover, a positive correlation was present between NLR and joint space narrowing score (p = 0.002) [22].
The presence of a significant correlation between NLR and osteoporosis in our study is supported by the results of another study conducted by Öztürk et al. [23] on the inverse relationship between NLR and bone mineral density (BMD) in elderly patients. They also compared levels of NLR in osteoporotic, osteopenic, and control groups and evaluated the correlation between NLR and BMD levels among 1635 patients aged ≥ 65 years or older. Dual-energy X-ray absorptiometry (DEXA) was used for measuring BMD in the lumbar spine and femur. The neutrophil-lymphocyte ratio levels were higher in the osteoporotic group than in the osteopenic group and control group (2.54 ±1.45, 2.37 ±1.00, and 2.18 ±0.85, respectively). The neutrophil-lymphocyte ratio had a significant negative correlation with the lumbar spine (L2–L4) (p <0.001) and femoral neck scores (p = 0.004). Multivariate analysis showed that NLR was an independent predictor for osteoporosis (OR = 1.12; 95% CI: 1.02–1.23, p = 0.018) [23].
We observed that RDW had a significant correlation with NLR. Red cell distribution width did not have a significant correlation with TJC, SJC, VAS, DAS28–ESR, RF, ACPA, RF, CRP, ESR, or radiographic joint erosions. However, in a study by Tecer et al. [24], RDW was positively correlated with disease activity parameters such as DAS28–ESR, DAS28–CRP, platelet counts, and VAS.
Another study observed that no significant correlation was present between ESR and RDW [10]. The lack of significant correlation between RDW and disease activity parameters in our study may be attributed to the change in the value of RDW in RA, due to the effect of anemia, cytotoxic drugs such as methotrexate, biologics, glucocorticosteroids, and inflammation. So, RDW has its shortcoming in determining the disease activity of RA [24].
A recent meta-analysis found that the NLR and platelet-lymphocyte ratio (PLR) were significantly increased in patients with RA and had a positive but weak correlation with RA activity. Logistic regression analysis showed that the NLR, RF, CRP, and ESR were independently related to the diagnosis of RA, while the PLR was not independently related to the diagnosis.
Analysis of the ROC curve showed that RF had an AUC of 0.974 with 87.5% sensitivity, 91% specificity, and 89% accuracy for the diagnosis of RA and was the most reliable indicator for the laboratory diagnosis of RA. The neutrophil-lymphocyte ratio had 76.7% sensitivity, 75.9% specificity, and 76.4% accuracy for the diagnosis of RA. All these values are higher than the corresponding values for ESR but lower than those of RF and CRP. These findings suggest that NLR is of less value than CRP and RF for diagnosing RA, but of more value than ESR, which is in common use to determine RA-related inflammatory activity [18].
Although these diagnostic indicators alone or in combination can be helpful in diagnosing RA, it is more prudent to use these indicators in combination. The neutrophil-lymphocyte ratio of more than 2.7 is an independent predictor while PLR is not an independent predictor for the failure of triple therapy for RA [25].
However, in our study, NLR showed an AUC of 0.78, 97.7% sensitivity, and 50% specificity for disease activity with DAS28–ESR as the gold standard. The positive predictive value of NLR for disease activity was 93.3% and the negative predictive value of NLR was 20%.
Likewise, in a study by Remalante et al. [26], ROC application for NLR in relation to DAS28–ESR to evaluate the discriminatory ability for predicting active disease demonstrated an AUC of 0.629 with 54.6% sensitivity and 76.9% specificity at a cut-off value of 2.32.
In our study, RDW showed the AUC 0.43, 70.5% sensitivity, and 41.7% specificity for disease activity with DAS28–ESR as the gold standard. The sensitivity and specificity of RDW were lower than those of NLR. Red cell distribution width had a positive predictive value of 90.0% and a negative predictive value of 16.7% for disease activity.
In a study by Remalante et al. [26], ROC application for RDW in relation to DAS28–ESR to evaluate the discriminatory ability for predicting active disease demonstrated an AUC of 0.516 with 55.6% sensitivity and 42.3% specificity at a cut-off value ≥ 14.2%. This is in accordance with our findings that RDW is a poor inflammatory marker in predicting active disease in patients with RA.
Study limitations
The limitations of our study were a relatively small sample size and a cross-sectional design. There were many confounding factors such as age, smoking habit, malnutrition, use of glucocorticosteroids, conventional DMARDs, and biologics. An imbalance in NLR, especially a reduction in the number of neutrophils, can occur due to biologics that inhibit tumor necrosis factor (TNF).
The low number of patients does not allow us to determine whether this effect in patients on anti-TNF therapy is only associated with drug administration or truly reflects disease activity. However, the low number of patients on anti-TNF therapy was not likely to significantly affect the results.
Other blood indices such as PLR and monocyte-lymphocyte ratio were not evaluated in relation to disease activity parameters.
Conclusions
The neutrophil-lymphocyte ratio had good AUC, sensitivity, and specificity for active RA and significantly correlated with ESR, the severity of pain estimated by VAS, osteoporosis, and radiographic joint erosions in patients with RA reflecting active disease, but not with DAS28–ESR and CRP. Red cell distribution width showed a significant correlation with NLR but not with any other marker of disease activity.
Thus, NLR is useful as an inflammatory marker in rheumatoid arthritis while RDW is not of use in this regard.