
Introduction
Immune system dysregulation causes chronic inflammation in systemic lupus erythematosus (SLE). The dysfunction of the immune system results in the hyperactivity of macrophage and natural killer (NK) cells, reduced phagocytosis, and accumulation of apoptotic debris.
The adaptive immune system mediated by the B cells and T cells becomes autoreactive by producing autoantibodies. The accumulation of autoantibodies and apoptotic debris form an immune complex that will stimulate chronic inflammation causing damage to various organs [1, 2].
Acute exacerbations and remissions characterize the disease course of SLE. To obtain a better therapeutic outcome of SLE, physicians should closely monitor the patients’ disease activity. Evaluation of disease activity is helpful as a guide for therapy monitoring. Several tools are widely used for the disease monitoring of SLE.
One of the most common examinations to assess the SLE disease activity is the SLEDAI (Systemic Lupus Erythematosus Disease Activity Index) score. There are several versions of SLEDAI; one of them is the Mexican (Mex)-SLEDAI.
The Mexican SLEDAI is more practical for health centers with limited screening tools because it does not include immunological measurements such as anti-double-stranded DNA (anti-dsDNA) and complement levels [3, 4].
Natural killer (NK) cells are essential for eliminating viruses and tumor cells and have a vital role in some auto-immune diseases. Natural killer cells in humans are defined as CD3–CD56+.
Based on the density of the CD56 molecules, NK cells are divided into two main subsets, namely CD3–CD56bright (regulator) and CD3–CD56dim (cytotoxic). Regulatory NK cells can produce cytokines such as interferon γ (IFN-γ) which are more than cytotoxic NK cells. In contrast, cytotoxic NK cells have more remarkable cytolytic ability than the regulatory NK cells [5–7].
Patients with SLE have reduced NK cell counts [8]. The decrease in the number will lead to lower NK cell function. Studies on the subset and activity of NK cells will provide a better picture of the pathophysiology of NK cells in SLE patients. Based on this background, it is necessary to determine the profile of CD3–CD56bright and CD3–CD56dim NK cells in SLE patients and their relationship with SLE disease activity scores.
Material and methods
Design and study subjects
This research was a cross-sectional study performed in Saiful Anwar General Hospital, Malang, Indonesia. The subjects of this study were 18–49-year-old female SLE patients who fulfilled the American College of Rheumatology (ACR) 1997 or Systemic Lupus International Collaborating Clinics (SLICC) 2012 criteria and were referred to the Rheumatology Clinic in Saiful Anwar General Hospital, Malang, Indonesia [9].
Patients who were pregnant, breastfeeding, had a previous history of cancer, trauma, or severe infections were excluded from the study. All SLE patients in the clinic were assessed for eligibility by the attending physicians and rheumatologists.
All patients were evaluated for the disease activity using the Mex-SLEDAI score as the routine examination. Patients were classified as active if the Mex-SLEDAI score was ≥ 5 and inactive if the Mex-SLEDAI score was < 5 [10].
In patients who fulfilled the criteria, 15 ml of peripheral venous blood was taken and put in a vacutainer with ethylenediaminetetraacetic acid (EDTA). The minimal number of the subjects was calculated by the following formula: n = 2 [((Zα+Zβ) S)/((x1 – x2))]2 [11].
This study used 95% as the confidence interval (CI), with the power of the study being 80%. According to the previous study, the calculation of S, x1, and x2 was 40.8, 14, and 7 [8].
Thus, the minimal number of participants from each group was 18 SLE patients.
Patients were recruited by a simple random sampling method to minimize bias. In addition, to minimize the information bias, assessment of the disease activity and eligibility of the subjects was carried out by at least two doctors from the clinic.
Peripheral blood mononuclear cell isolation and sorting natural killer cells by flow cytometry
Isolation of PBMC was performed for the determination of NK cell subsets and NK cell surface markers. Peripheral blood mononuclear cells were obtained from 18 mm of blood samples with EDTA from all SLE patients by centrifugation of density Lymphoprep 1.07 (Axis-Shield, Norway), then separated and washed.
The purity of the isolation results was confirmed by FACSMelody (BD Bioscience) by staining PerCP-conjugated anti-CD3 antibody (BioLegend, San Diego, CA) and FITC-conjugated anti-CD56 antibody (BioLegend, San Diego, CA).
The number of cells was analyzed by BD Cell Quest software. The analysis resulted in the percentage (%) of cells. According to Lin et al. [12], the population of lymphocytes was gated to confirm CD3– and CD3+ lymphocytes.
Then, the population of CD3-negative lymphocytes was gated for the next analysis of CD56 expression. The results are expressed as the percentage of isolated NK cells (CD3–CD56+). The isolated NK cells were further sorted as CD56dim and CD56bright.
Statistical analysis
The Mann-Whitney U test was used to analyze differences in the number and expression of NK cell phenotypes between active and inactive SLE patients. Spearman’s test was used to assess the correlation between variables. Data were described as mean ±standard deviation (SD) and considered significant if the p-value < 0.05. Statistical analysis was performed using SPSS version 21.
Results
Patients’ characteristics
The flowchart of the eligibility for the participants in this study is shown in Figure 1. There were 67 SLE patients from the Rheumatology Clinic who were assessed for the study’s eligibility. Twenty-nine (43.2%) participants were excluded from the study because they did not fulfill the inclusion criteria. There were 38 patients enrolled in this study.
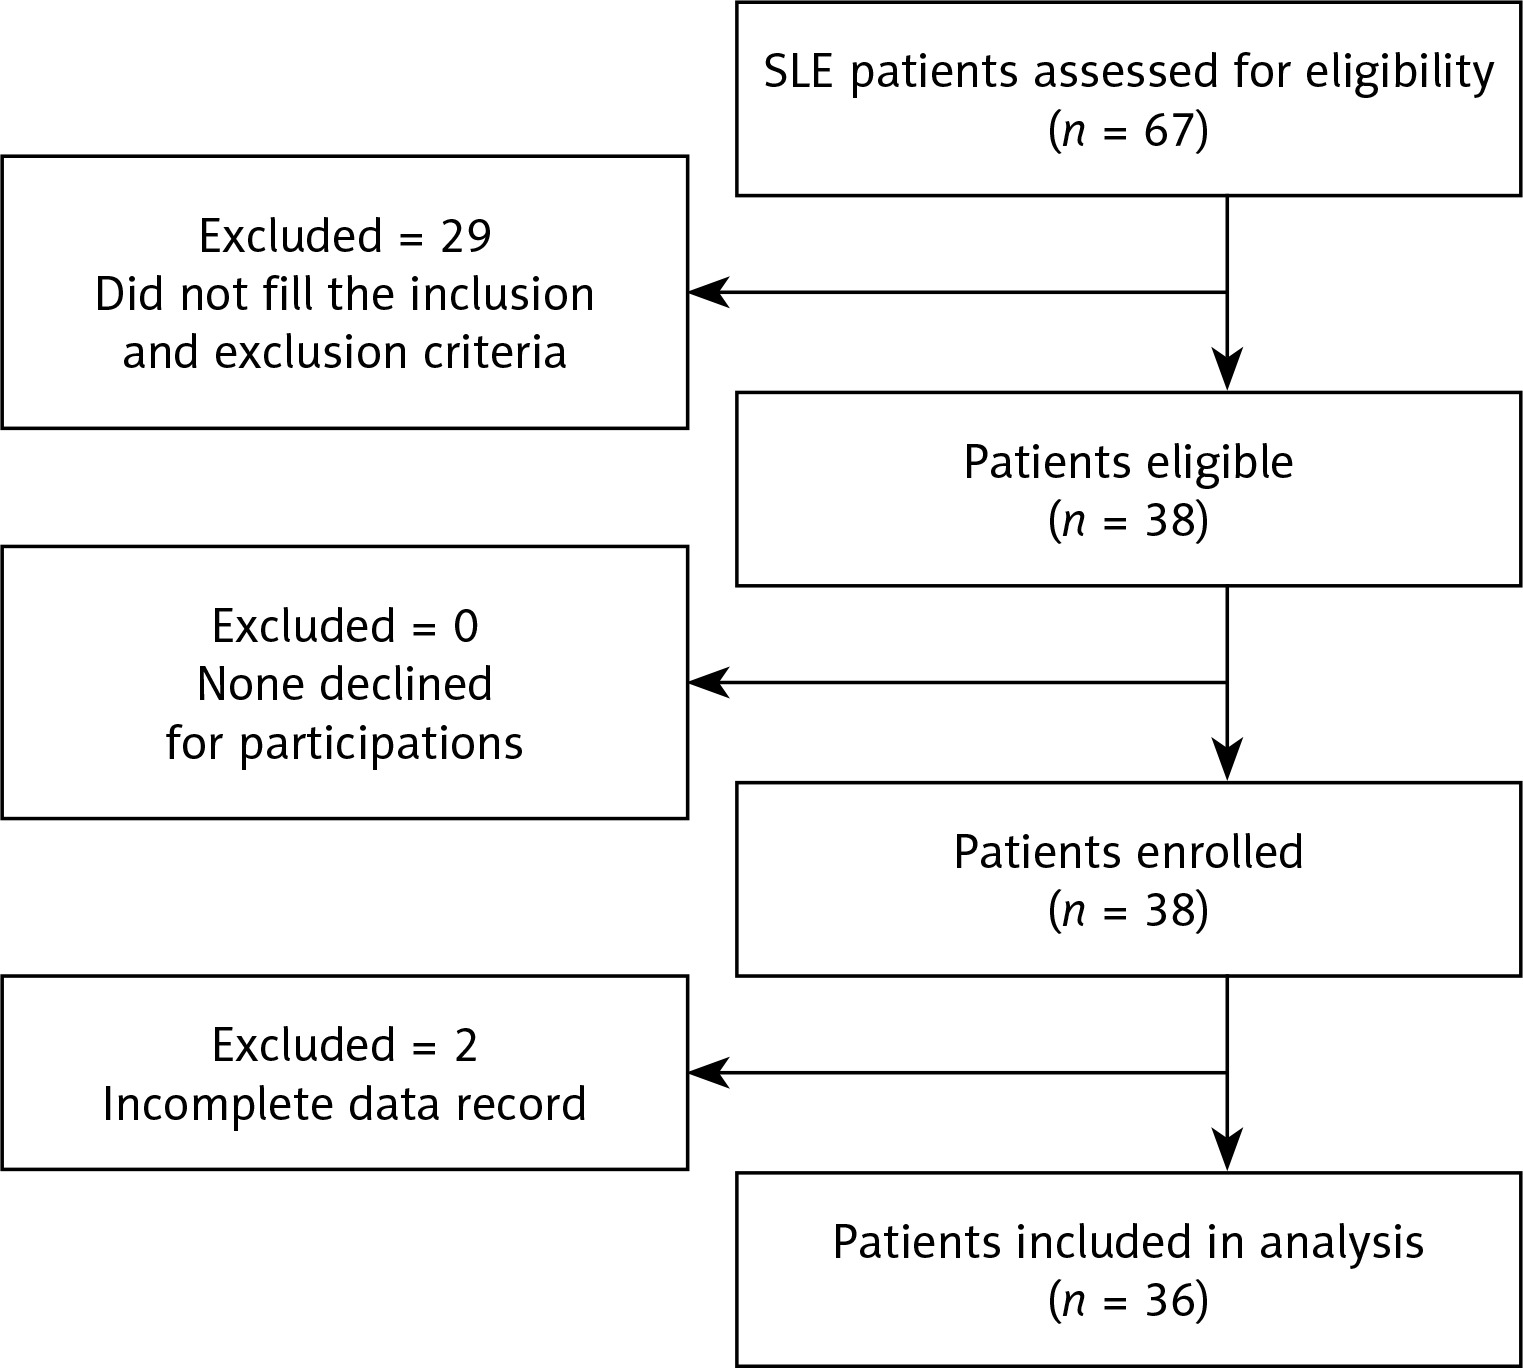
However, two (2.9%) were excluded from the analysis because of incomplete data. In the end, 36 patients were included in the analysis (18 active SLE and 18 inactive SLE patients). The characteristics of the patients are shown in Table I.
Table I
Characteristics of active and inactive patients with systemic lupus erythematosus
| Characteristic | Active (n = 18) (mean ±SD) | Inactive (n = 18) (mean ±SD) | p-value |
|---|---|---|---|
| Age, mean (range) | 31.5 ±7.3 (21–44) | 29.3 ±6.3 (19–47) | 0.485 |
| Average disease duration [months] | 34.6 ±30.8 | 36.0 ±35.4 | 0.849 |
| Mex-SLEDAI | 8.8 ±2.8 | 3.2 ±1.0 | 0.000* |
| Hemoglobin [g/dl] | 10.3 ±2.5 | 11.1 ±1.5 | 0.296 |
| Leukocytes [× 103/μl] | 6.523 ±4.055 | 6.567 ±2.362 | 0.506 |
| Lymphocytes [× 103/μl] | 0.962 ±0.529 | 1.401 ±0.638 | 0.058 |
| Thrombocytes [× 103/μl] | 226.388 ±83.457 | 317.216 ±71.400 | 0.003* |
| Medications [frequency (%)] | |||
| GC | 18 (100) | 11 (61.1) | 0.003* |
| Mean GC dose (range) Methylprednisolone [mg/day] | 8.7 ±10.5 (4–48) | 2.4 ±2.0 (0–4) | 0.001* |
| Hydroxychloroquine | 10 (55.5) | 11 (61.1) | 0.735 |
| Azathioprine | 8 (44.4) | 4 (22.2) | 0.157 |
| Mycophenolate mofetil | 2 (11.1) | 1 (5.5) | 0.546 |
Mexican SLEDAI in active SLE patients was significantly higher than inactive (8.8 ±2.8 vs. 3.2 ±1.0; p = 0.000). The Mex-SLEDAI score was used to differentiate the status of SLE disease activity between active and inactive patients. Patients with active disease also had a significantly lower mean platelet count compared to the inactive SLE patients (226,388.9 ±83,457.7/µl vs. 317,216.7 ±71,400.6/µl; p = 0.003). The distribution of medication that was given to the subjects is shown in Table I.
The frequency of glucocorticosteroids (GCs) given in active SLE patients was higher in active patients compared to inactive SLE patients (p = 0.003). The mean dosage of GCs given was also significantly higher in active patients compared to inactive patients (p = 0.001).
On the other hand, there was no significant difference in the frequencies for the other treatments given by both groups.
Percentages of CD3–CD56bright and CD3–CD56dim of systemic lupus erythematosus patients
Natural killer cells expressed as regulatory CD3–CD56+ were sorted into two main subsets, regulatory CD3–CD56bright and cytotoxic CD3–CD56dim NK cells (Fig. 2). There was a difference between the percentages of the regulatory NK cell subset (CD3–CD56bright) and the cytotoxic NK cell subset (CD3–CD56dim).
Fig. 2
Percentages of CD3–CD56bright and CD3–CD56dim of systemic lupus erythematosus patients. Natural killer cells obtained from PBMC isolation of systemic lupus erythematosus patients, stained with PerCP antihuman CD3 and FITC anti-human CD56, then analyzed with FACSMelody. The lymphocyte population was gated to identify CD3– and CD3+. The CD3-negative lymphocytes were gated for further analysis of CD56 expression. Then CD3–CD56+ was sorted into 2 subsets of CD56dim and CD56bright of NK cells. The CD3–CD56bright subset was significantly lower than CD3–CD56dim in active SLE (A); CD3–CD56bright was lower than CD3–CD56dim in inactive systemic lupus erythematosus, but without significance (B).
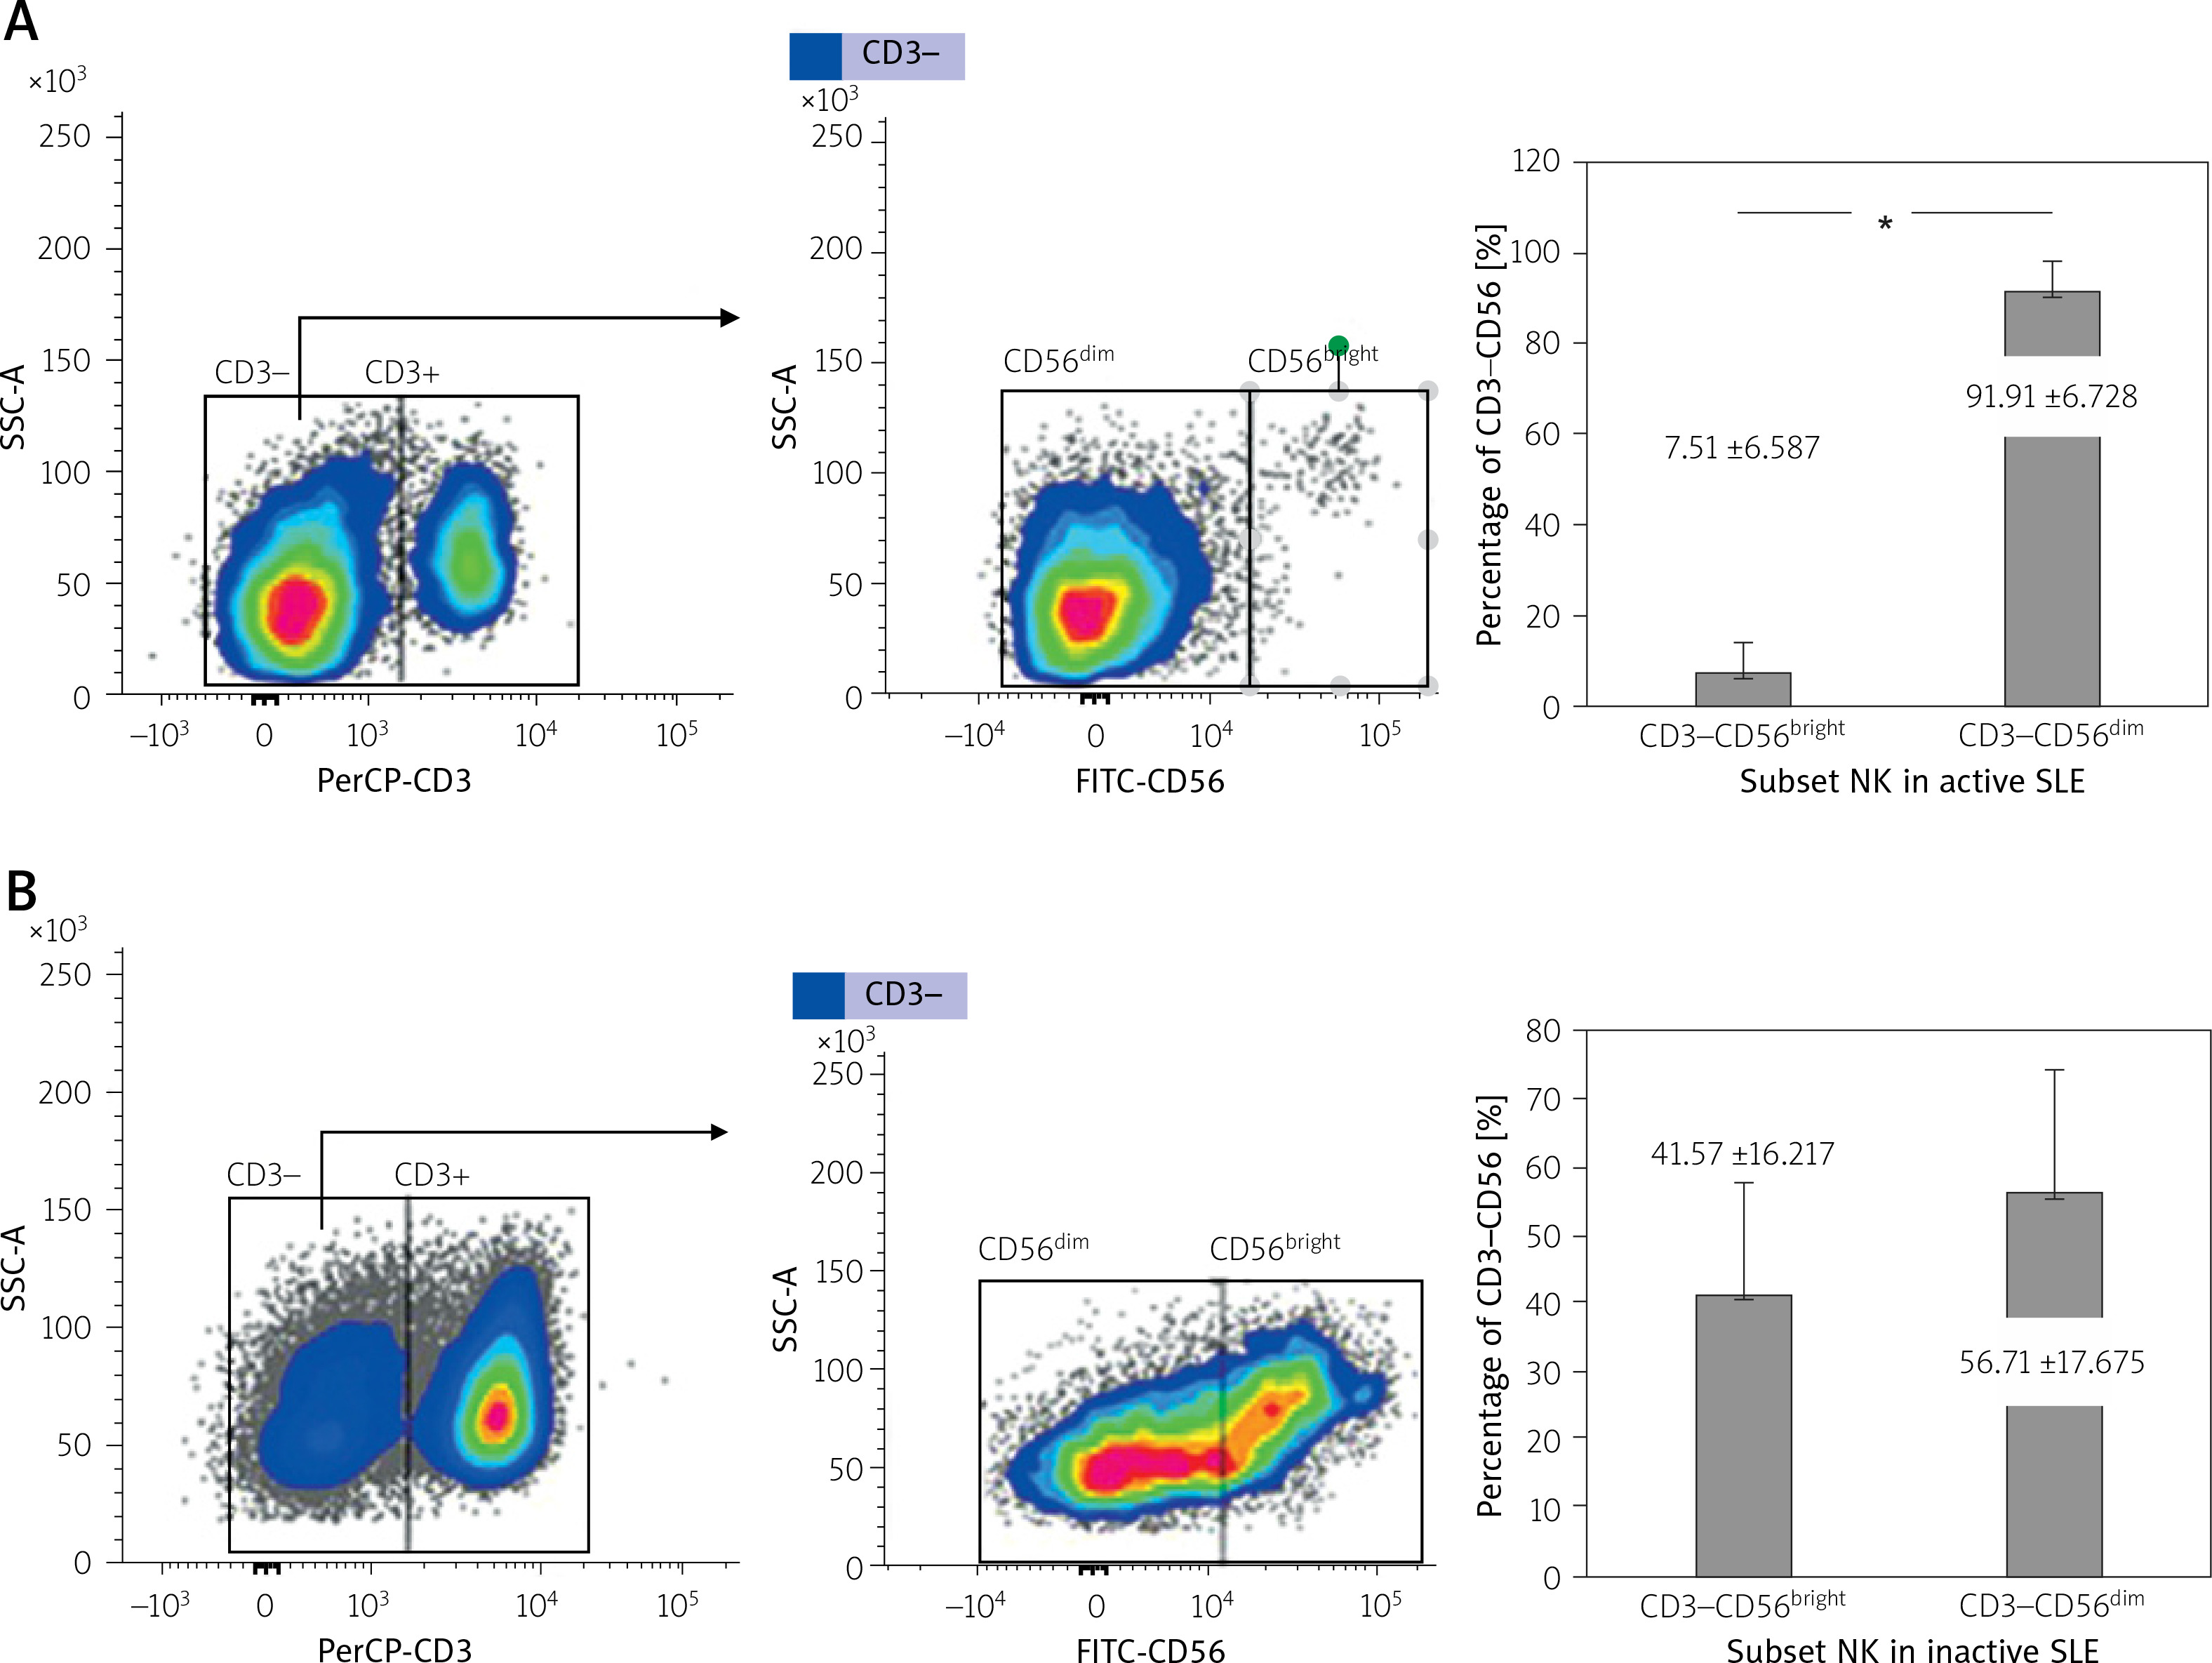
In active SLE patients, the percentage of CD3–CD56bright was lower than CD3–CD56dim (7.5 ±6.6 vs. 91.9 ±6.7; p = 0.000). No significant difference was found between the percentage of CD3–CD56bright and CD3–CD56dim in inactive patients (41.6 ±16.2 vs. 56.7 ±17.7; p = 0.085).
Moreover, our data showed some significant differences between the mean percentage of the NK cells in both subsets between active and inactive SLE patients, as shown in Figure 3.
Fig. 3
The difference of NK subsets in active and inactive SLE. The mean percentage of CD3–CD56bright in active was lower than in inactive SLE. The mean percentage of CD3–CD56dim in active was higher than in inactive SLE patients.
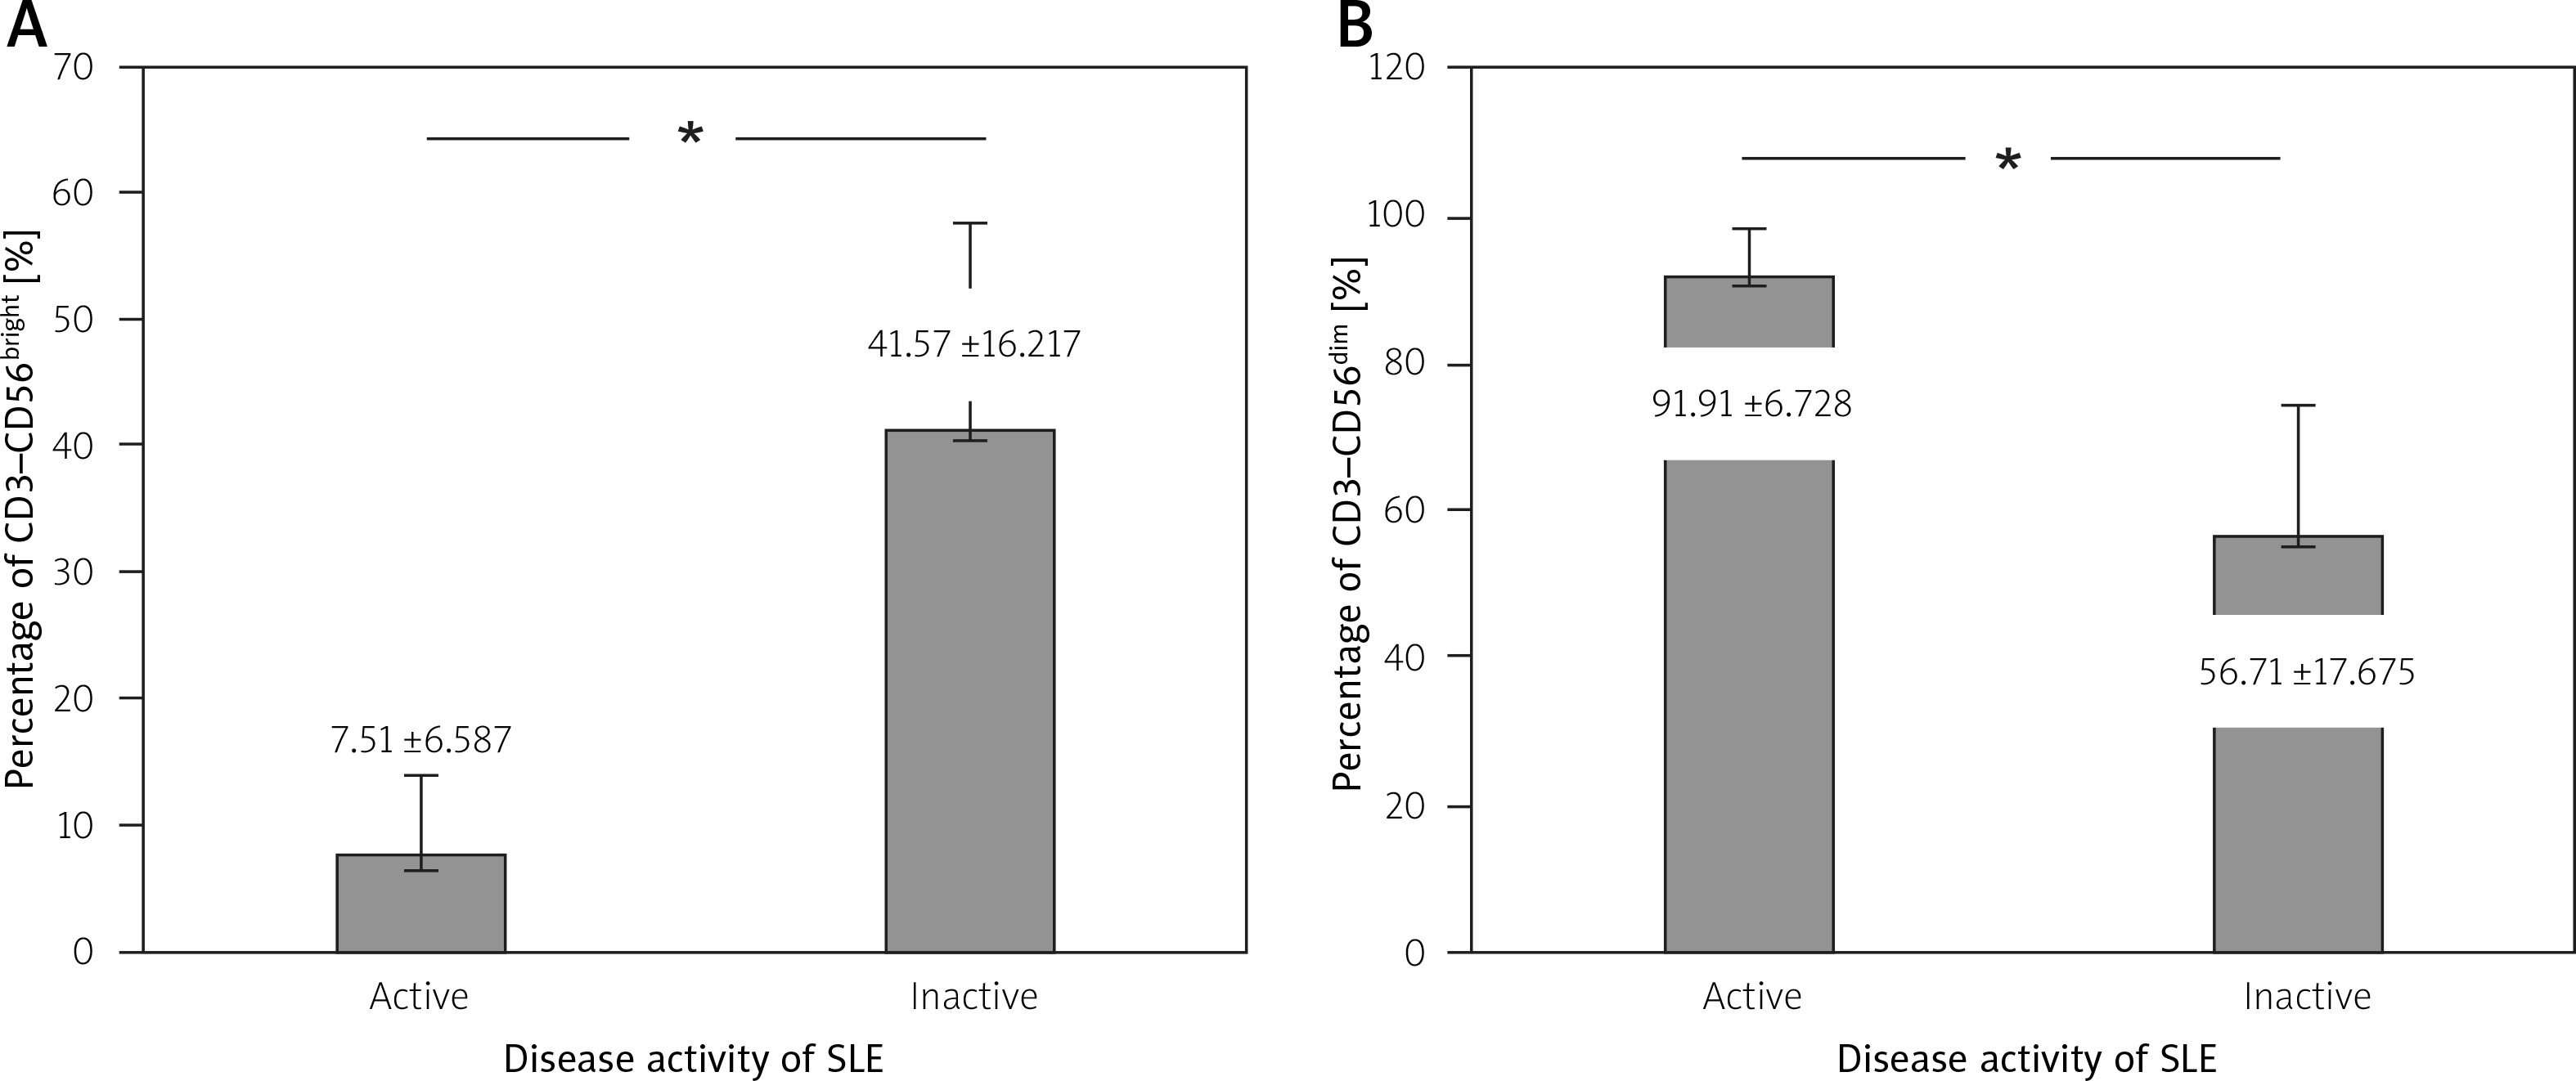
In active SLE patients, the percentage of regulatory CD3–CD56bright was significantly lower than in inactive patients (7.5 ±6.6 vs. 41.6 ±16.2; p = 0.000). The percentage of cytotoxic NK CD3–CD56dim in active SLE patients was significantly higher compared to inactive patients (91.9 ±6.8 vs. 56.7 ±17.7; p = 0.000).
Correlation between the number of CD3–CD56bright and CD3–CD56dim natural killer cell subsets in systemic lupus erythematosus patients with systemic lupus erythematosus disease activity
The correlation of the percentages from subsets of regulatory NK cells (CD3–CD56bright) and cytotoxic NK cells (CD3–CD56dim) with SLE disease activity is shown in Figure 4.
Fig. 4
Correlation between SLE disease activity with subset of NK cells. (A) Inverse correlation between disease activity with percentage of CD3–CD56bright; (B) Positive correlation between disease activity with CD3–CD56dim.
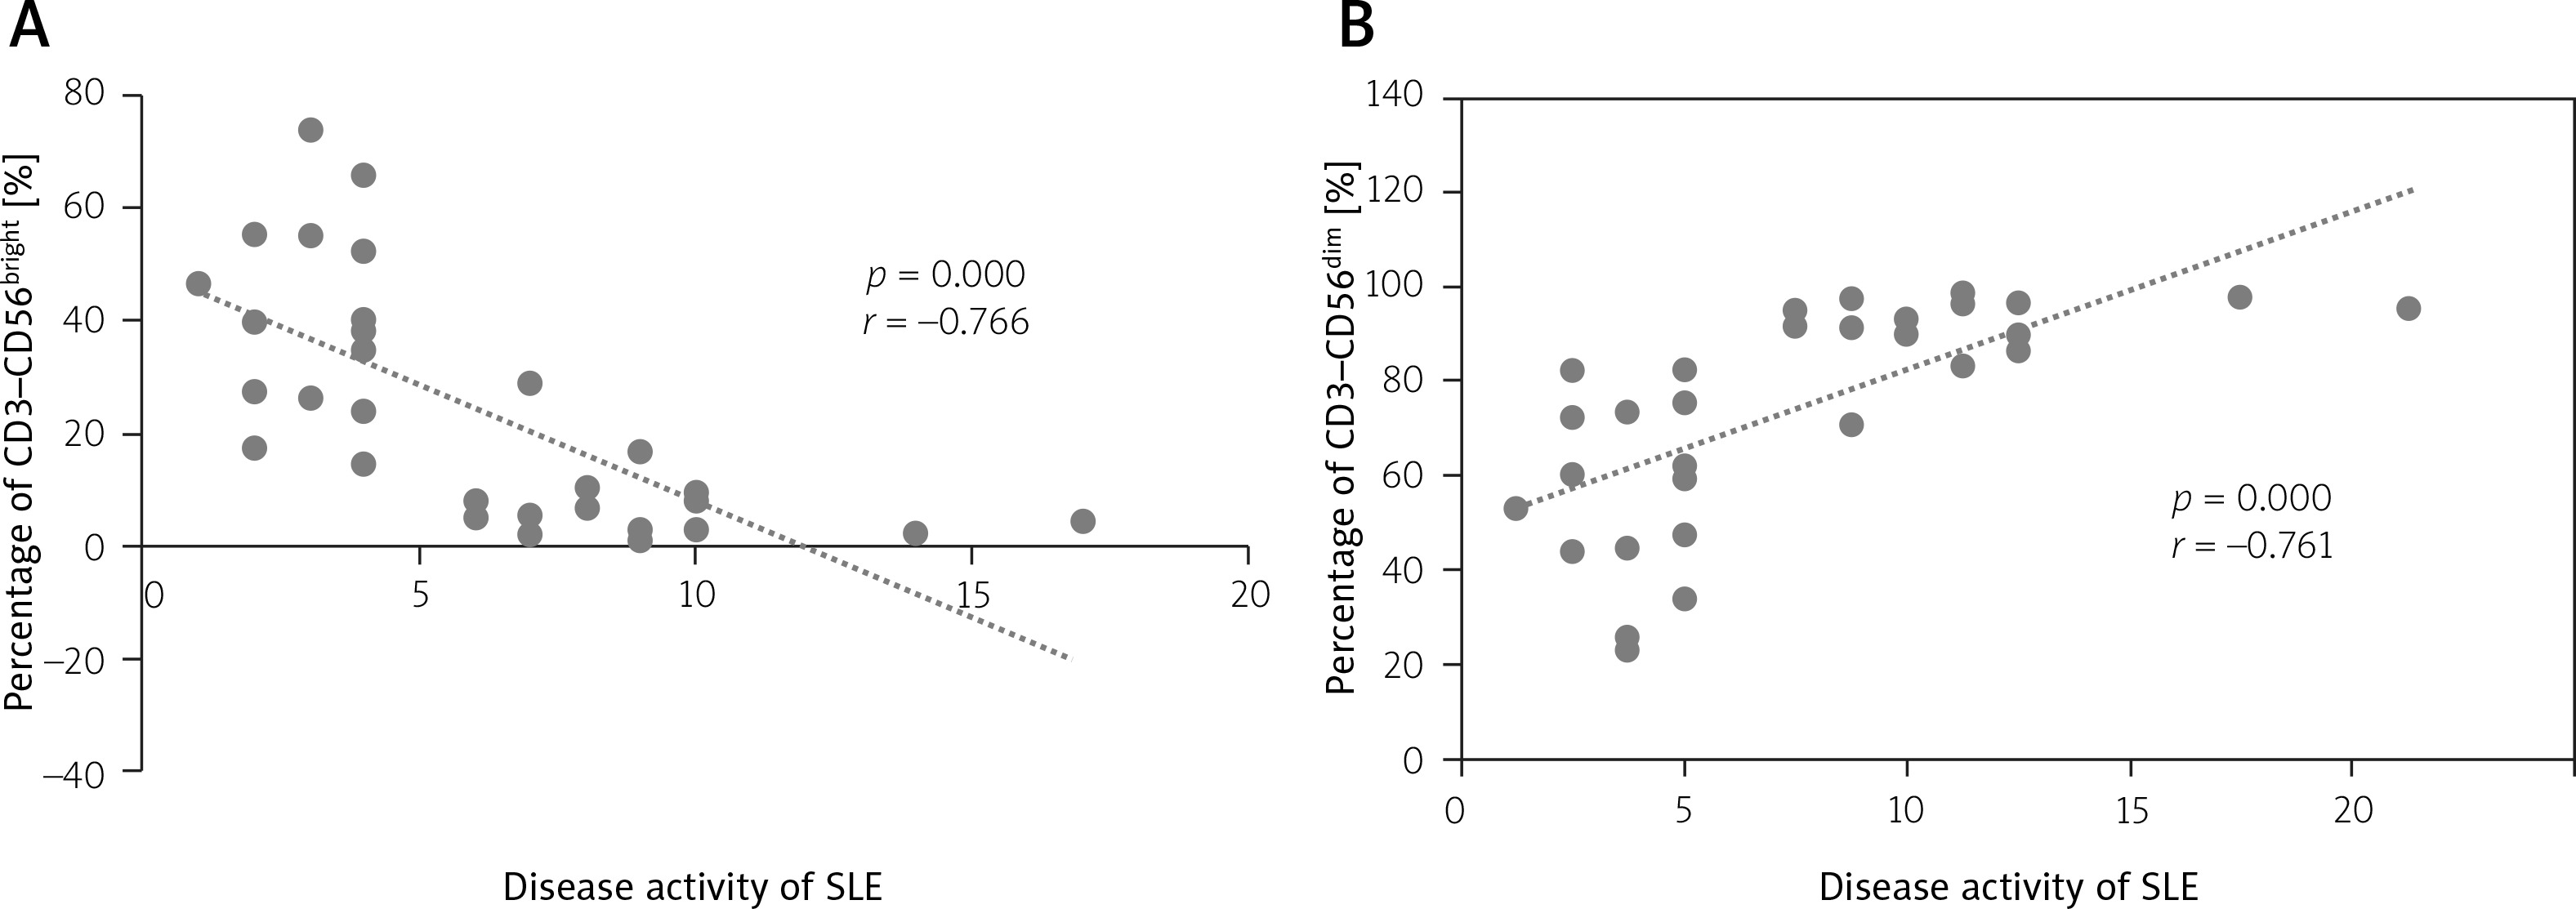
The results demonstrated that there was an inverse correlation between the mean percentage of regulatory NK cells (CD3–CD56bright) and SLE disease activity (p = 0.000; r = 0.766) (Fig. 4 A). There was also a positive correlation between the mean percentage of the cytotoxic NK cell subset (CD3–CD56dim) and SLE disease activity (p = 0.000; r = 0.761; Fig. 4 B).
Percentages of CD3–CD56bright and CD3–CD56dim according to the medication given in systemic lupus erythematosus patients
Figure 5 A, B shows the comparison between the percentages of CD3–CD56bright and CD3–CD56dim according to the GCs given to the subjects. Systemic lupus erythematosus patients who received GCs had significantly lower CD3–CD56bright percentages (20.2 ±20.5% vs. 42.6 ±14.9%, p = 0.009) and higher CD3–CD56dim percentages (78.4 ±21.8% vs. 57.2 ±14.9%, p = 0.014) compared to the subjects who did not receive the GCs.
Fig. 5
Correlation between systemic lupus erythematosus disease activity and GC therapy. Comparison of CD3–CD56bright according to the use of GC (A); comparison of CD3–CD56dim according to the use of GC (B); inverse correlation of CD3–CD56bright with the GC dose, positive correlation of CD3–CD56dim with the GC dose (C).
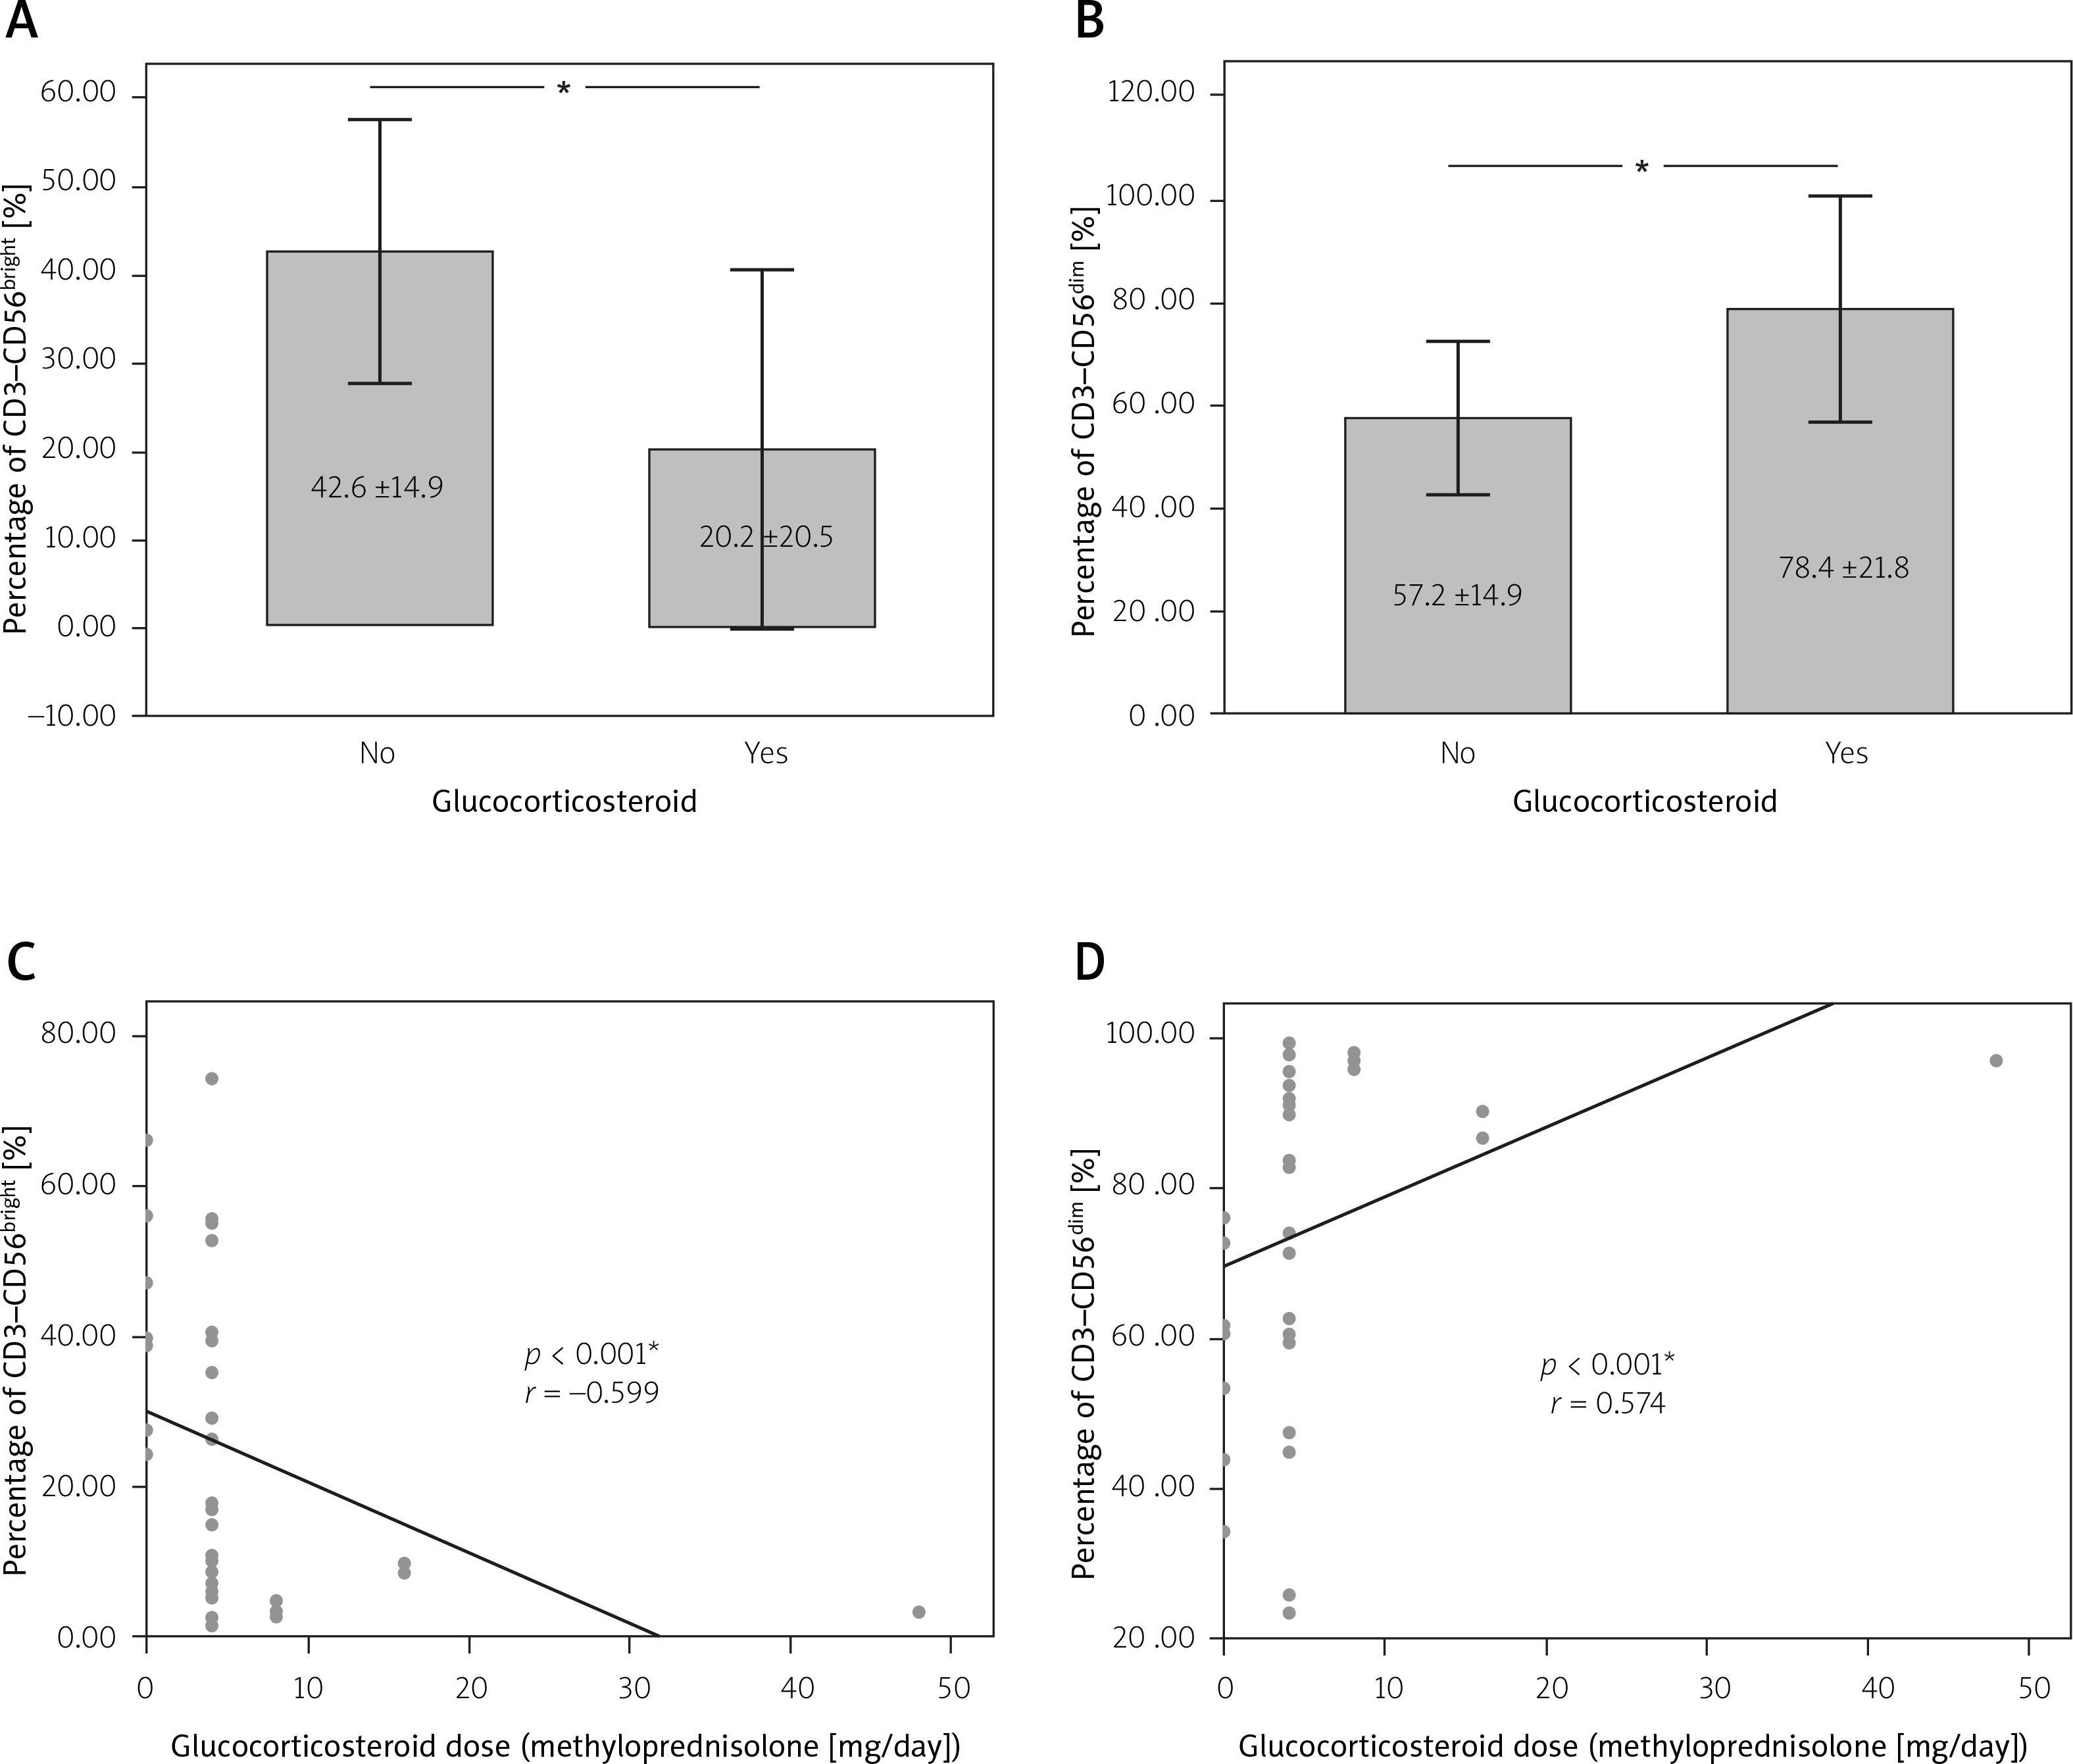
On the other hand, the dose of GCs given to the SLE patients was significantly correlated with the CD3–CD56bright (p < 0.001, r = –0.599) and CD3–CD56dim percentages (p < 0.001, r = 0.574), as shown in Figure 5 (C–D).
However, the CD3–CD56bright and CD3–CD56dim percentages did not significantly differ in patients who obtained hydroxychloroquine (p = 0.776 and p = 0.950), azathioprine (p = 0.156 and p = 0.128), or mycophenolate mofetil (p = 0.872 and p = 0.872) compared to the patients who did not receive these medications.
Discussion
Our study demonstrated that the profile of NK cells, including regulatory NK cells (CD3–CD56bright) and cytotoxic NK cells (CD3–CD56dim), was different between patients with active and inactive disease activity. The average percentage of regulatory NK cell counts (CD3–CD56bright) in active SLE patients was lower than in inactive SLE patients.
In contrast, the mean percentage of cytotoxic NK cell counts (CD3–CD56dim) in active SLE patients was higher than in inactive SLE patients. The low percentage of the number of the two major subsets of NK cells, especially in active SLE patients, suggests that there might be a decrease in the total number of NK cells in autoimmune disease conditions such as SLE.
The lower NK cell count in SLE patients is similar to the previous studies’ findings [5, 8, 13].
In autoimmune conditions, the induction of apoptosis due to excessive antibody production causes the dysregulation and destruction of immune cells, leading to a decreasing number of blood cells, including NK cells. The decreasing number of NK cells can also later be associated with disease activity.
The condition of active SLE indeed contains more antibodies and pro-inflammatory cytokines, which will affect the activity of immune cells, including NK cells, causing a change in the proportion of the NK cell subset [14]. With a reduction of total NK cells in patients with active SLE, the ability of NK cells to proliferate is also lower.
This study demonstrated a significant relationship between the mean percentage of the subset of regulatory NK cells (CD3–CD56bright) and cytotoxic NK cells (CD3–CD56dim) with SLE disease activity. Natural killer cell of CD56bright was reported to be a regulatory NK cell that could suppress the T cell responses through many mechanisms [15].
A previous study also showed that CD56bright was impaired in patients with SLE and the administration of IL-2 was associated with the attenuation of disease activity and improvement of CD56bright populations in the peripheral blood [16].
In contrast to the CD56bright NK cells, CD56dim NK cells were associated with the cytotoxic activity of NK cells. CD56dim was able to secrete pro-inflammatory cytokines, such as IFN-γ [17].
Research by Huang et al. [18] demonstrated that NK cells participated in the pathogenesis of SLE by activation and production of IFN-γ in an amyloid-induced experimental lupus-like syndrome model.
We found that the medications for the SLE patients were correlated with the CD56bright or CD56dim NK cells, especially the GCs. However, it is still not known whether the correlation was directly caused by GCs or another factor, since the dosage of GCs itself was also positively correlated with disease activity.
The role of GCs in the physiology of NK cells remains elusive. Systemic lupus erythematosus patients were documented as having impaired cytotoxicity in NK cell function, showed by decreased CD56dim NK cells.
A previous study showed that the therapy of SLE would increase the number of NK cells [19]. Ni et al. [20] also reported that the administration of a GC or immunosuppressant agent was able to reshape the CD56bright and CD56dim NK cells, changing them from the cytotoxic subset into the regulatory subset.
Study limitations
Our study described the role of NK cells in patients with SLE. However, there were some limitations of this study. The number of subjects was relatively small. This research was carried out during the COVID-19 pandemic, so it was quite difficult to obtain patients according to the inclusion criteria.
This preliminary study also only showed the number of NK cell subsets and did not demonstrate the function of these subsets in SLE patients, for example, the ability to secrete pro-inflammatory cytokines. This study did not use the EULAR/ACR 2019 criteria because we collected the subjects before establishing the EULAR/ACR 2019 criteria. Thus, we used the previous ACR1997/SLICC 2012 criteria during the study.
In addition, to assess the disease activity in this study, the Mex-SLEDAI score was used instead of the SLEDAI-2K because of limitations in the clinical settings. However, a previous study showed that the Mex-SLEDAI score was strongly correlated with the SLEDAI-2K score [10] and could be applied in several settings when complement or anti-dsDNA could not be observed.
Despite several limitations in this study, there is still an open opportunity to develop the study about the role of NK cells in the pathogenesis and treatment of SLE with a bigger sample size and more parameters.
Conclusions
The results of the present study indicate a difference in the mean percentage of the number of NK cells (CD3–CD56+), both subsets of regulatory NK cells (CD3–CD56bright) and cytotoxic NK cells (CD3–CD56dim) in active and inactive SLE patients and a relationship between these NK subsets and SLE activity.