
Introduction
Systemic lupus erythematosus (SLE) is a complex autoimmune disease influenced by multiple factors, including environmental triggers, genetic predisposition, and immune system dysfunction. These factors lead to the production of autoantibodies, stimulation of B cells, and activation of T cells, contributing to the pathology of the disease [1]. While the exact mechanisms underlying SLE are not fully understood, it is believed that genetics, environmental factors, and hormones play significant roles in disease development [2].
Cytokines, including tumor necrosis factor α (TNF-α), interleukin-10 (IL-10), IL-6, and IL-8, are believed to be involved in SLE pathology because of their roles in immune responses and inflammation. In this study, we focused on two specific SNPs: TNF-α rs1800629 (-308 G/A) and IL-10 rs1800872 (-819 C/T). These SNPs were chosen based on their significant associations reported in previous studies and high relevance to SLE [3].
Tumor necrosis factor α is produced as a trimer on cell surfaces, and its soluble form is released following activation of macrophages and dendritic cells. Research has shown that serum levels of TNF α are elevated in SLE patients compared to healthy individuals, with higher levels correlating with active disease [4]. The -308 position in the TNF-α gene, known as TNF-α-308A or TNF α2, has been associated with increased TNF-α production and greater susceptibility to SLE, particularly when a minor allele is present [5]. The functional significance of TNF-α polymorphisms in SLE lies in their ability to mediate inflammation and immune responses. Tumor necrosis factor α promotes the activation and recruitment of immune cells to inflammation sites, enhances the expression of adhesion molecules on endothelial cells, and stimulates the production of other proinflammatory cytokines. These actions contribute to the chronic inflammatory state observed in SLE and can lead to tissue damage and organ dysfunction [6].
Interleukin-10 is another cytokine linked to the pathogenesis of lupus, and is essential for inhibiting inflammatory reactions [7]. Elevated levels of IL-10 may contribute to the increased production of autoantibodies and formation of pathogenic autoantibody-antigen complexes. Higher serum concentrations of IL-10 have been associated with increased disease activity [8]. Interleukin-10 is a protein produced by various immune cells, and its role can vary depending on the surrounding conditions. CD4+ T cells are thought to play a pivotal role in abnormal regulation of IL-10 production. Variations in IL-10 levels can contribute to the pathogenesis of SLE by promoting the survival and proliferation of autoreactive B cells, leading to the increased production of autoantibodies and the formation of immune complexes. These immune complexes can be deposited in tissues and organs, causing inflammation and damage [9]. Specifically, IL-10 SNP rs1800896 (-1082 T/C) has been linked to SLE susceptibility [10].
Several studies have investigated the association between IL-10 and TNF-α polymorphisms and their possible involvement in SLE susceptibility. However, findings from individual studies have been contradictory, likely because of inadequate statistical power and small sample sizes. Given the increasing amount of research conducted on different populations and the potential significance of these polymorphisms in the pathological processes of SLE, a meta-analysis was performed to obtain a more accurate estimation of the relationship between TNF α and IL-10 polymorphisms and susceptibility to SLE.
Material and methods
The study followed the Preferred Reporting Items for Systematic Reviews and Meta-analyses. The prospective review protocol of the study was registered with the International Prospective Register of Systematic Reviews (PROSPERO) under ID number 560993, ensuring the reliability of the research.
Search strategy
Three primary databases, Google Scholar, PubMed, and Embase, were thoroughly searched to find pertinent studies on the relationship between genetic variations and SLE up to 2024. Various combinations of search terms such as “SLE,” “systemic lupus erythematosus”, and “cytokines”, and “single nucleotide polymorphism (SNP)”, and “case-control association” were used. A manual search of published articles supplemented the results.
Ethical considerations
Ethical approval was not required, because this study was based on published case-control studies, and patient consent forms were unnecessary, as the study was a meta-analysis.
Study selection
The individual responsible for reviewing the literature (PKCS) screened the abstracts and titles independently and repeatedly. After reviewing the records thoroughly, the reviewer conducted a second assessment, which included crosschecking and comparison. In cases of disagreement regarding the selection of studies and review process, the reviewers discussed the issues and reached a consensus. Finally, studies were selected based on the reviewers’ agreement.
The following criteria were taken into consideration when determining whether a study should be included:
study design: only case-control studies examining gene polymorphisms in SLE patients and healthy controls were included;
subjects: this study included only human participants;
population: this study included individuals whose SLE results were confirmed using reverse transcription-polymerase chain reaction (RT-PCR) or polymerase chain reaction-restriction fragment length polymorphism (PCR-RFLP) validation;
article type: genetic variation and SLE analyses were conducted using a case-control study design;
genetic data: genotype information was analyzed for the case and control groups;
only English was used in this study.
The exclusion criteria were as follows:
irrelevant study designs: studies that were not case-control studies, such as cohort studies or experimental trials, were excluded;
duplicate studies: duplicate publications were excluded to avoid double-counting the data;
low quality: studies that did not meet the predetermined quality criteria were excluded;
insufficient data: studies that did not report the necessary data for inclusion in the meta-analysis were excluded;
studies with confounding factors: studies that did not adequately control for potential confounding variables were excluded;
non-human studies: studies conducted on animals or in vitro models were excluded unless explicitly relevant to the research question.
Data extraction
We aimed to gather information from various publications regarding the first author’s surname, the country from which the participants were recruited, year of publication, ethnicity, sex distribution, source of control groups, and genotyping methods. The reviewer (PKCS) independently conducted the literature search, selected eligible studies, and retrieved data. All aspects were agreed upon by consensus.
Quality assessment
The p-value was calculated for the Hardy-Weinberg equilibrium (HWE) probability value. In addition, methodological biases in studies that met the inclusion criteria were evaluated using Newcastle-Ottawa Scale. It is essential to thoroughly assess the methodology and potential biases in the studies included in meta-analyses, considering that the risk of bias plays a critical role. Using Robvis software, we categorized these investigations according to the risk level, which included high risk, uncertain risk with some concerns, or low risk, indicating the degree of risk associated with each study.
Statistical analysis
This study aimed to determine whether there is a correlation between SLE and TNF-α and IL 10 gene polymorphisms by analyzing data using various statistical techniques. The odds ratio (OR) and 95% confidence interval (CI) were calculated with a significance level of p < 0.05. The consistency of the results across studies was evaluated using the index of inconsistency (I2), where lower scores indicated increased consistency. Different models (fixed-effect or random-effect) were used based on heterogeneity levels, which were determined by the c2 test using Q statistics. Odds ratios were computed using the Z-test, with the combined OR representing the pooled effect estimate. The findings were considered significant if the Egger’s test yielded p < 0.05. The index of inconsistency and Egger’s test statistics were used to assess publication bias, with potential bias indicated if p < 0.05. We used Review Manager version 5.4 and Cochrane Rob Tool 2 for our statistical analysis.
Results
Search results
Figure 1 illustrates a flowchart detailing the study selection process. Of the 328 studies identified based on the search terms, there were 312 exclusions based on these criteria. Sixteen relevant articles, representing 17 studies, were included in the analysis. Among these, 9 studies with 2,500 SLE patients and 2,547 controls reported IL-10 genotypes, whereas 8 studies with 1,877 SLE patients and 2,133 controls reported TNF-α genotypes. Table I shows the first author’s surname, ethnicity, publication year, sex distribution, quality score, frequencies of various genotypes, and HWE values of the included studies. Most eligible studies were population-based, and all studies used PCR techniques. The genotype distributions of the control populations following HWE in the four studies are shown in Table I.
Fig. 1
Flow chart of literature screening of investigated TNF-α rs1800629 and IL-10 rs1800896 gene polymorphisms.
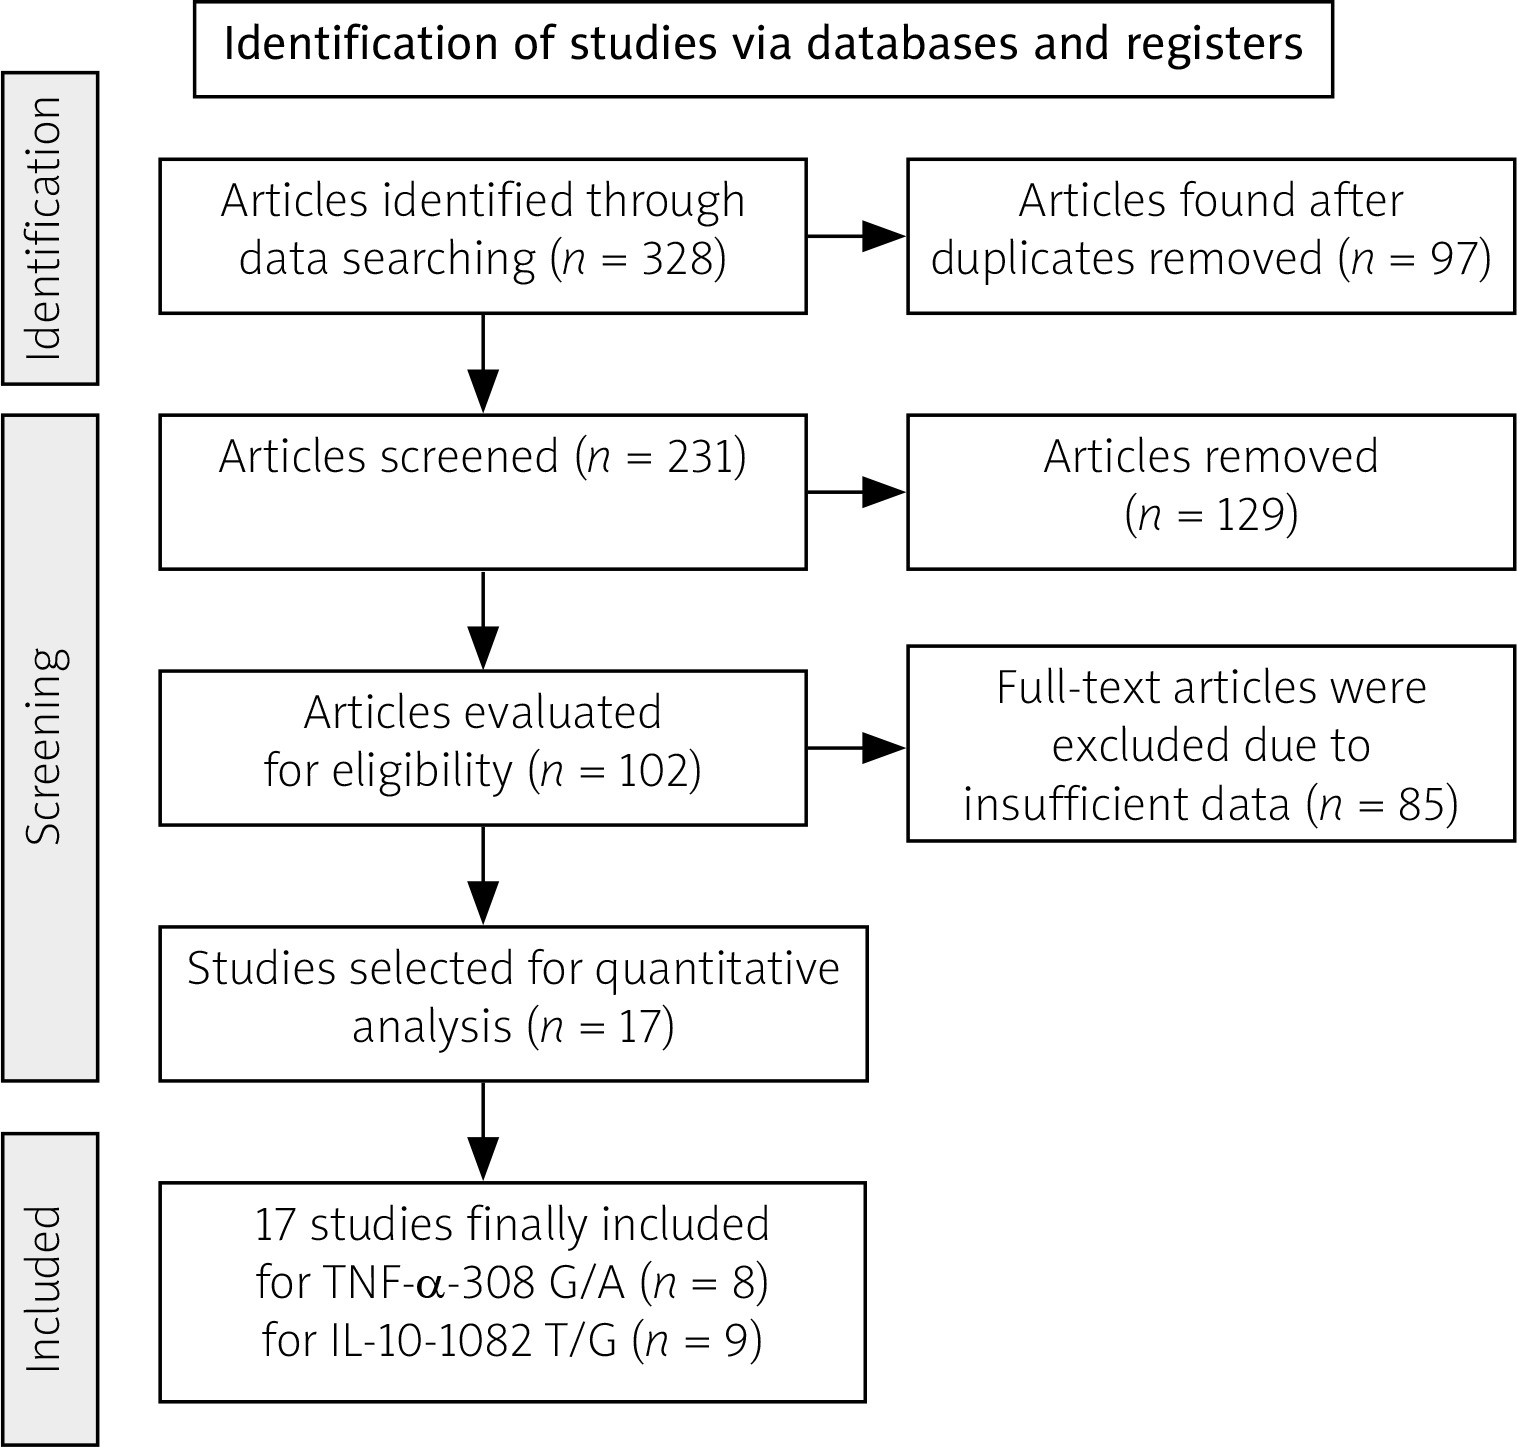
Table I
Characteristics of studies on the association of TNF-α (rs1800629) and IL-10 (rs1800896) gene polymorphism with SLE risk
| Author, year, reference | Gene | Genotypic frequency | Allele frequency | Sample size | Ethnicity | HWE | |||||||||
|---|---|---|---|---|---|---|---|---|---|---|---|---|---|---|---|
| Case | Control | Case | Control | ||||||||||||
| GG | GC | CC | GG | GC | CC | G | C | G | C | Case | Control | ||||
| Rageh et al. 2016 [19] | TNF-α | 32 | 13 | 5 | 42 | 7 | 1 | 77 | 23 | 91 | 9 | 50 | 50 | Caucasian | 0.304 |
| Al-Kholy et al. 2016 [18] | TNF-α | 92 | 28 | 5 | 98 | 13 | 1 | 212 | 38 | 209 | 15 | 125 | 112 | Caucasian | 0.451 |
| Manolova et al. 2018 [16] | TNF-α | 88 | 65 | 1 | 179 | 42 | 3 | 241 | 67 | 400 | 48 | 154 | 224 | Asian | 0.764 |
| Mashayekh et al. 2022 [22] | TNF-α | 0 | 90 | 30 | 0 | 85 | 35 | 90 | 150 | 85 | 155 | 120 | 120 | Asian | 0 |
| Ramírez-Bello et al. 2018 [20] | TNF-α | 398 | 44 | 0 | 450 | 43 | 2 | 840 | 44 | 943 | 47 | 442 | 495 | Cauasian | 0.379 |
| Umare et al. 2016 [17] | TNF-α | 138 | 51 | 11 | 168 | 30 | 3 | 327 | 73 | 366 | 36 | 200 | 201 | Asian | 0.229 |
| Yang et al. 2016 [21] | TNF-α | 384 | 120 | 52 | 468 | 86 | 16 | 888 | 224 | 1,022 | 118 | 556 | 570 | Asian | 0.00008 |
| Talaat et al. 2015 [26] | IL-10 | 18 | 42 | 40 | 11 | 78 | 30 | 78 | 122 | 100 | 138 | 100 | 119 | Caucasian | 0.0001 |
| Umare et al. 2020 [27] | IL-10 | 20 | 72 | 108 | 11 | 55 | 135 | 112 | 288 | 77 | 325 | 200 | 201 | Asian | 0.098 |
| Wang et al. 2020 [9] | IL-10 | 40 | 158 | 193 | 35 | 239 | 511 | 238 | 544 | 309 | 1261 | 391 | 785 | Asian | 0.299 |
| Rzeszotarska et al. 2022 [15] | IL-10 | 20 | 36 | 53 | 71 | 148 | 118 | 76 | 142 | 290 | 384 | 109 | 337 | Caucasian | 0.055 |
| Manolova et al. 2018 [16] | IL-10 | 88 | 65 | 1 | 179 | 42 | 3 | 241 | 67 | 400 | 48 | 154 | 224 | Asian | 0.089 |
| Wang et al. 2017 [28] | IL-10 | 27 | 192 | 360 | 7 | 95 | 530 | 246 | 912 | 109 | 1,155 | 579 | 632 | Asian | 0.245 |
| Zhang et al. 2017 [29] | IL-10 | 0 | 41 | 196 | 0 | 17 | 242 | 41 | 433 | 17 | 501 | 237 | 259 | Asian | 0.585 |
| Palafox-Sánchez et al. 2014 [30] | IL-10 | 13 | 50 | 62 | 24 | 103 | 133 | 76 | 174 | 151 | 369 | 125 | 260 | Caucasian | 0.532 |
| Silva et al. 2014 [31] | IL-10 | 1 | 81 | 8 | 8 | 72 | 20 | 83 | 97 | 88 | 112 | 90 | 100 | Caucasian | 0.00004 |
Risk bias
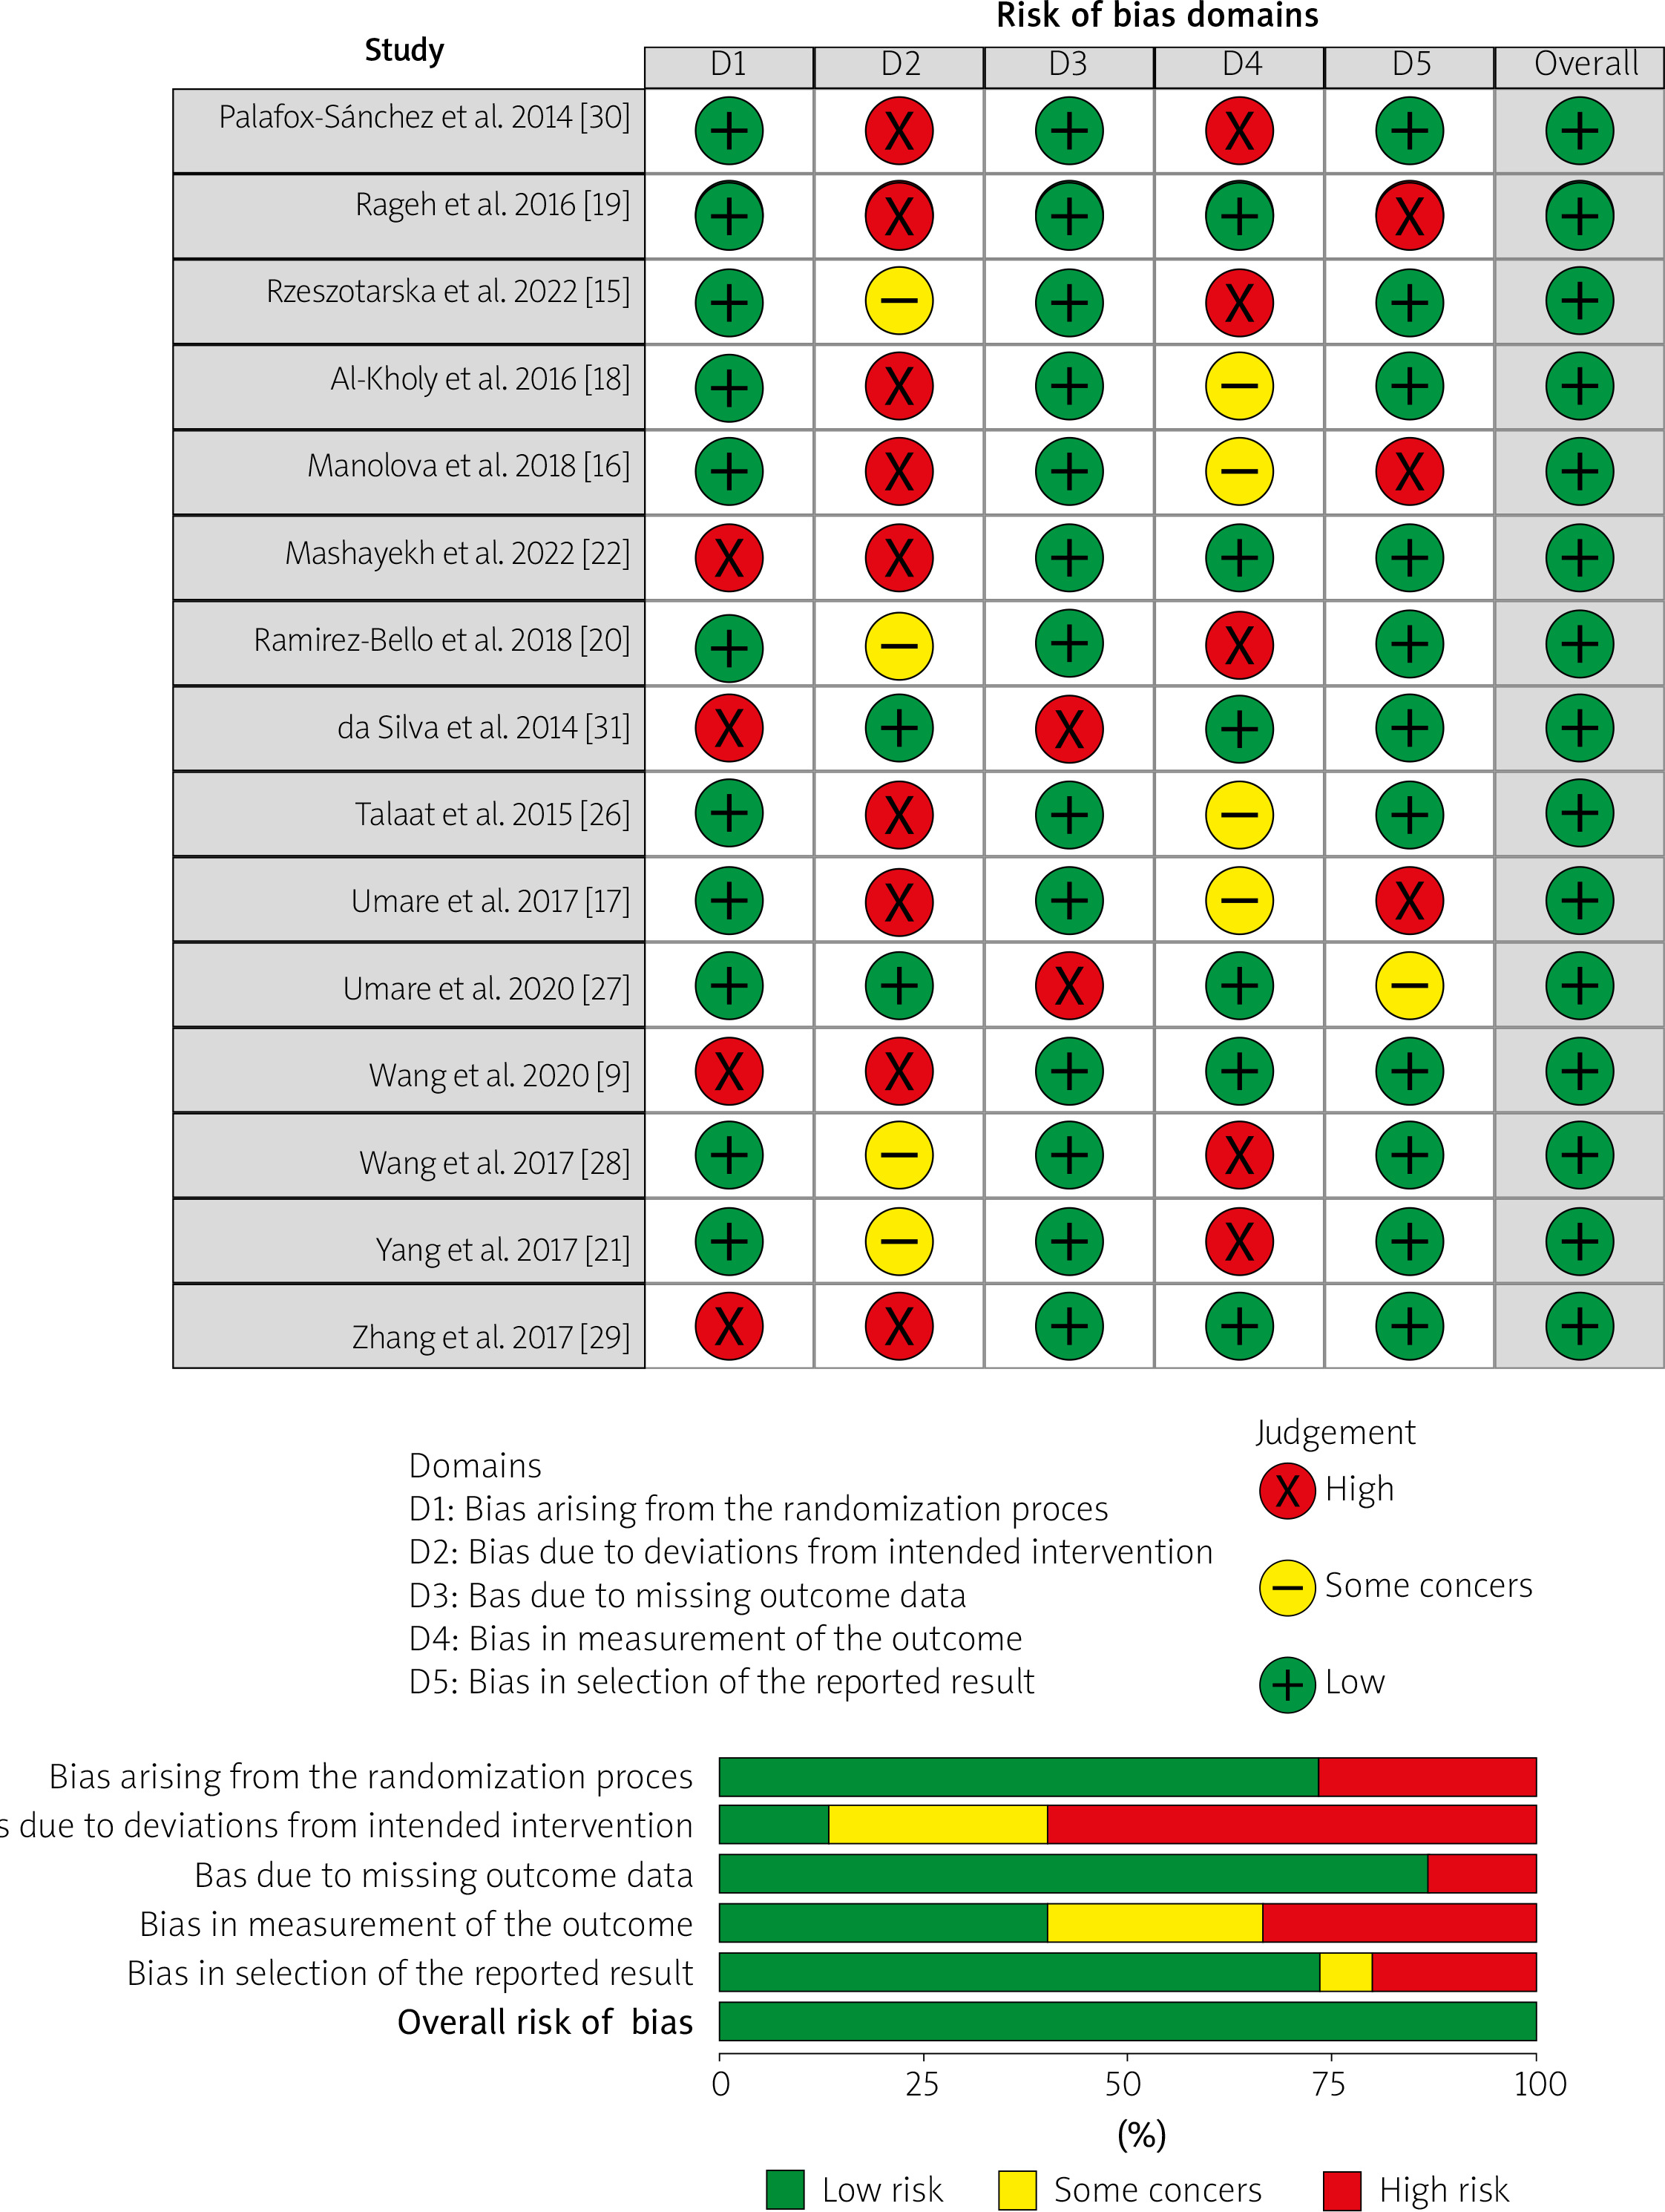
A comprehensive methodological quality assessment of the selected studies was conducted using Cochrane Rob Tool 2, as shown in Figure 2. In this representation, each study is described in a row and each column corresponds to a specific type of bias. The color assigned to each survey indicates the reviewer’s evaluation of the risk of bias associated with that particular type of analysis. Studies with a low risk of bias are represented in green, whereas those with a high risk of bias are shown in red. Yellow indicates unclear risk of bias. Overall, the findings suggest a significantly low risk of bias for the selected studies, indicating that the research was conducted, executed, and documented to substantially minimize or eliminate potential bias or error.
Data analysis
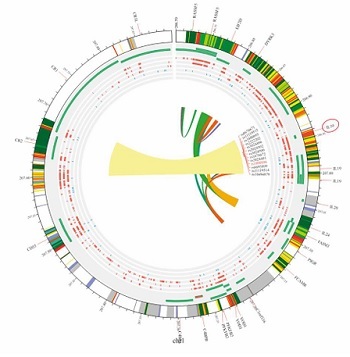
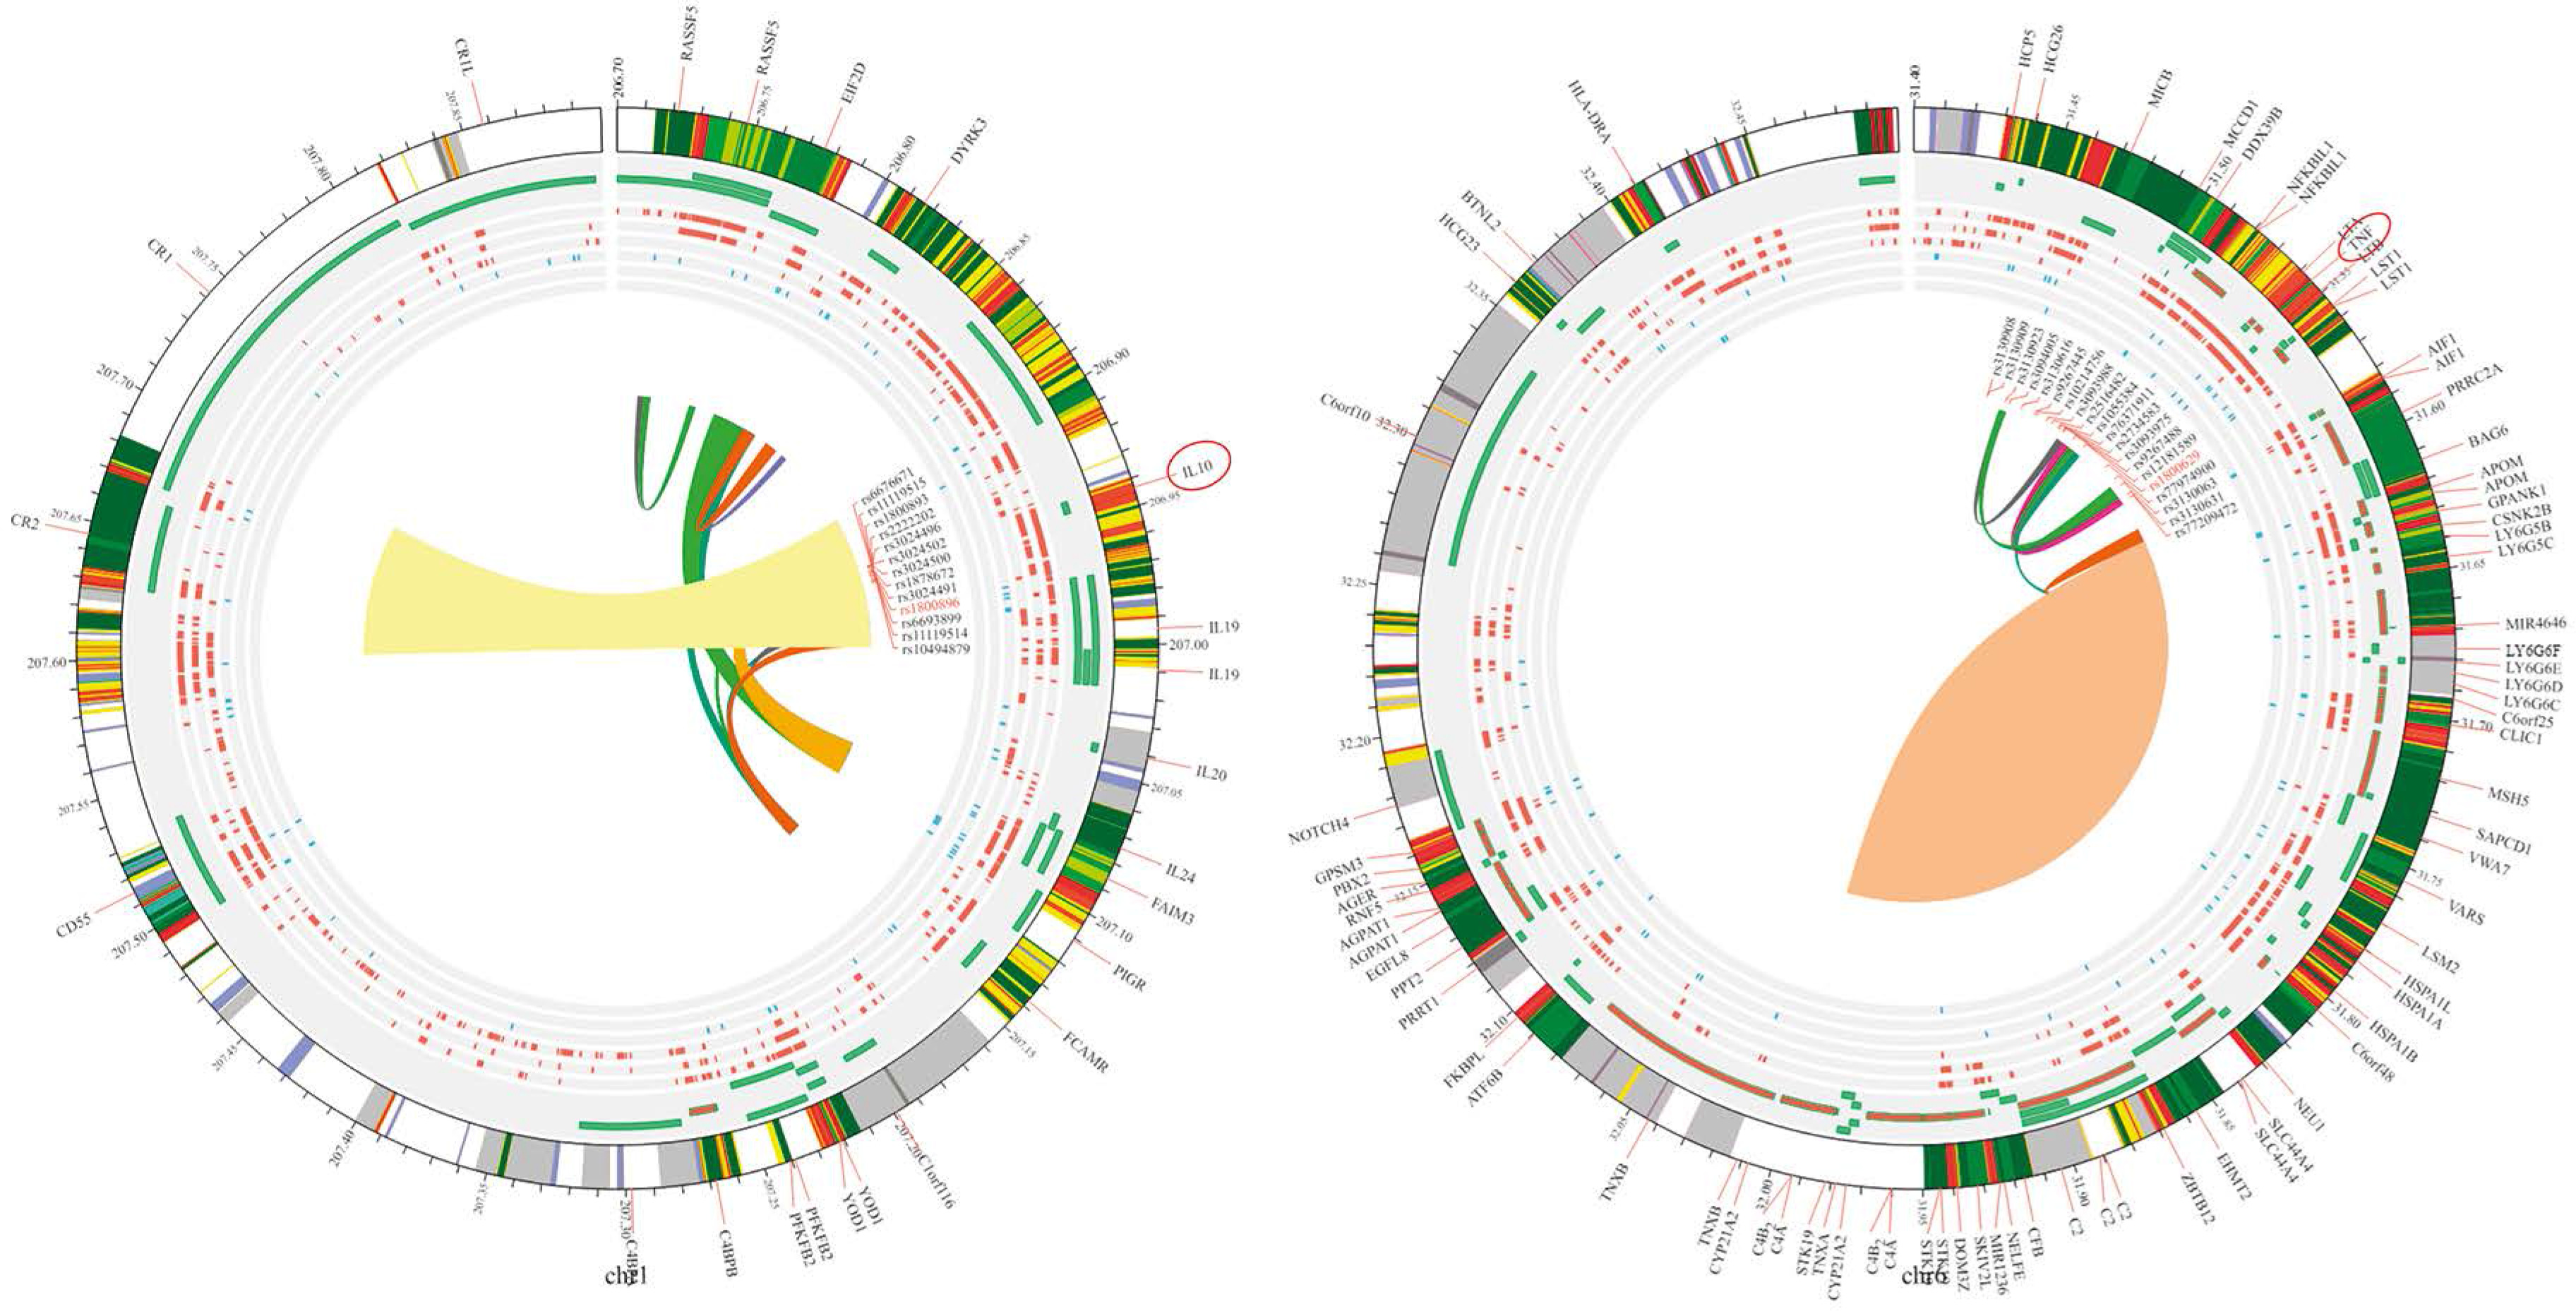
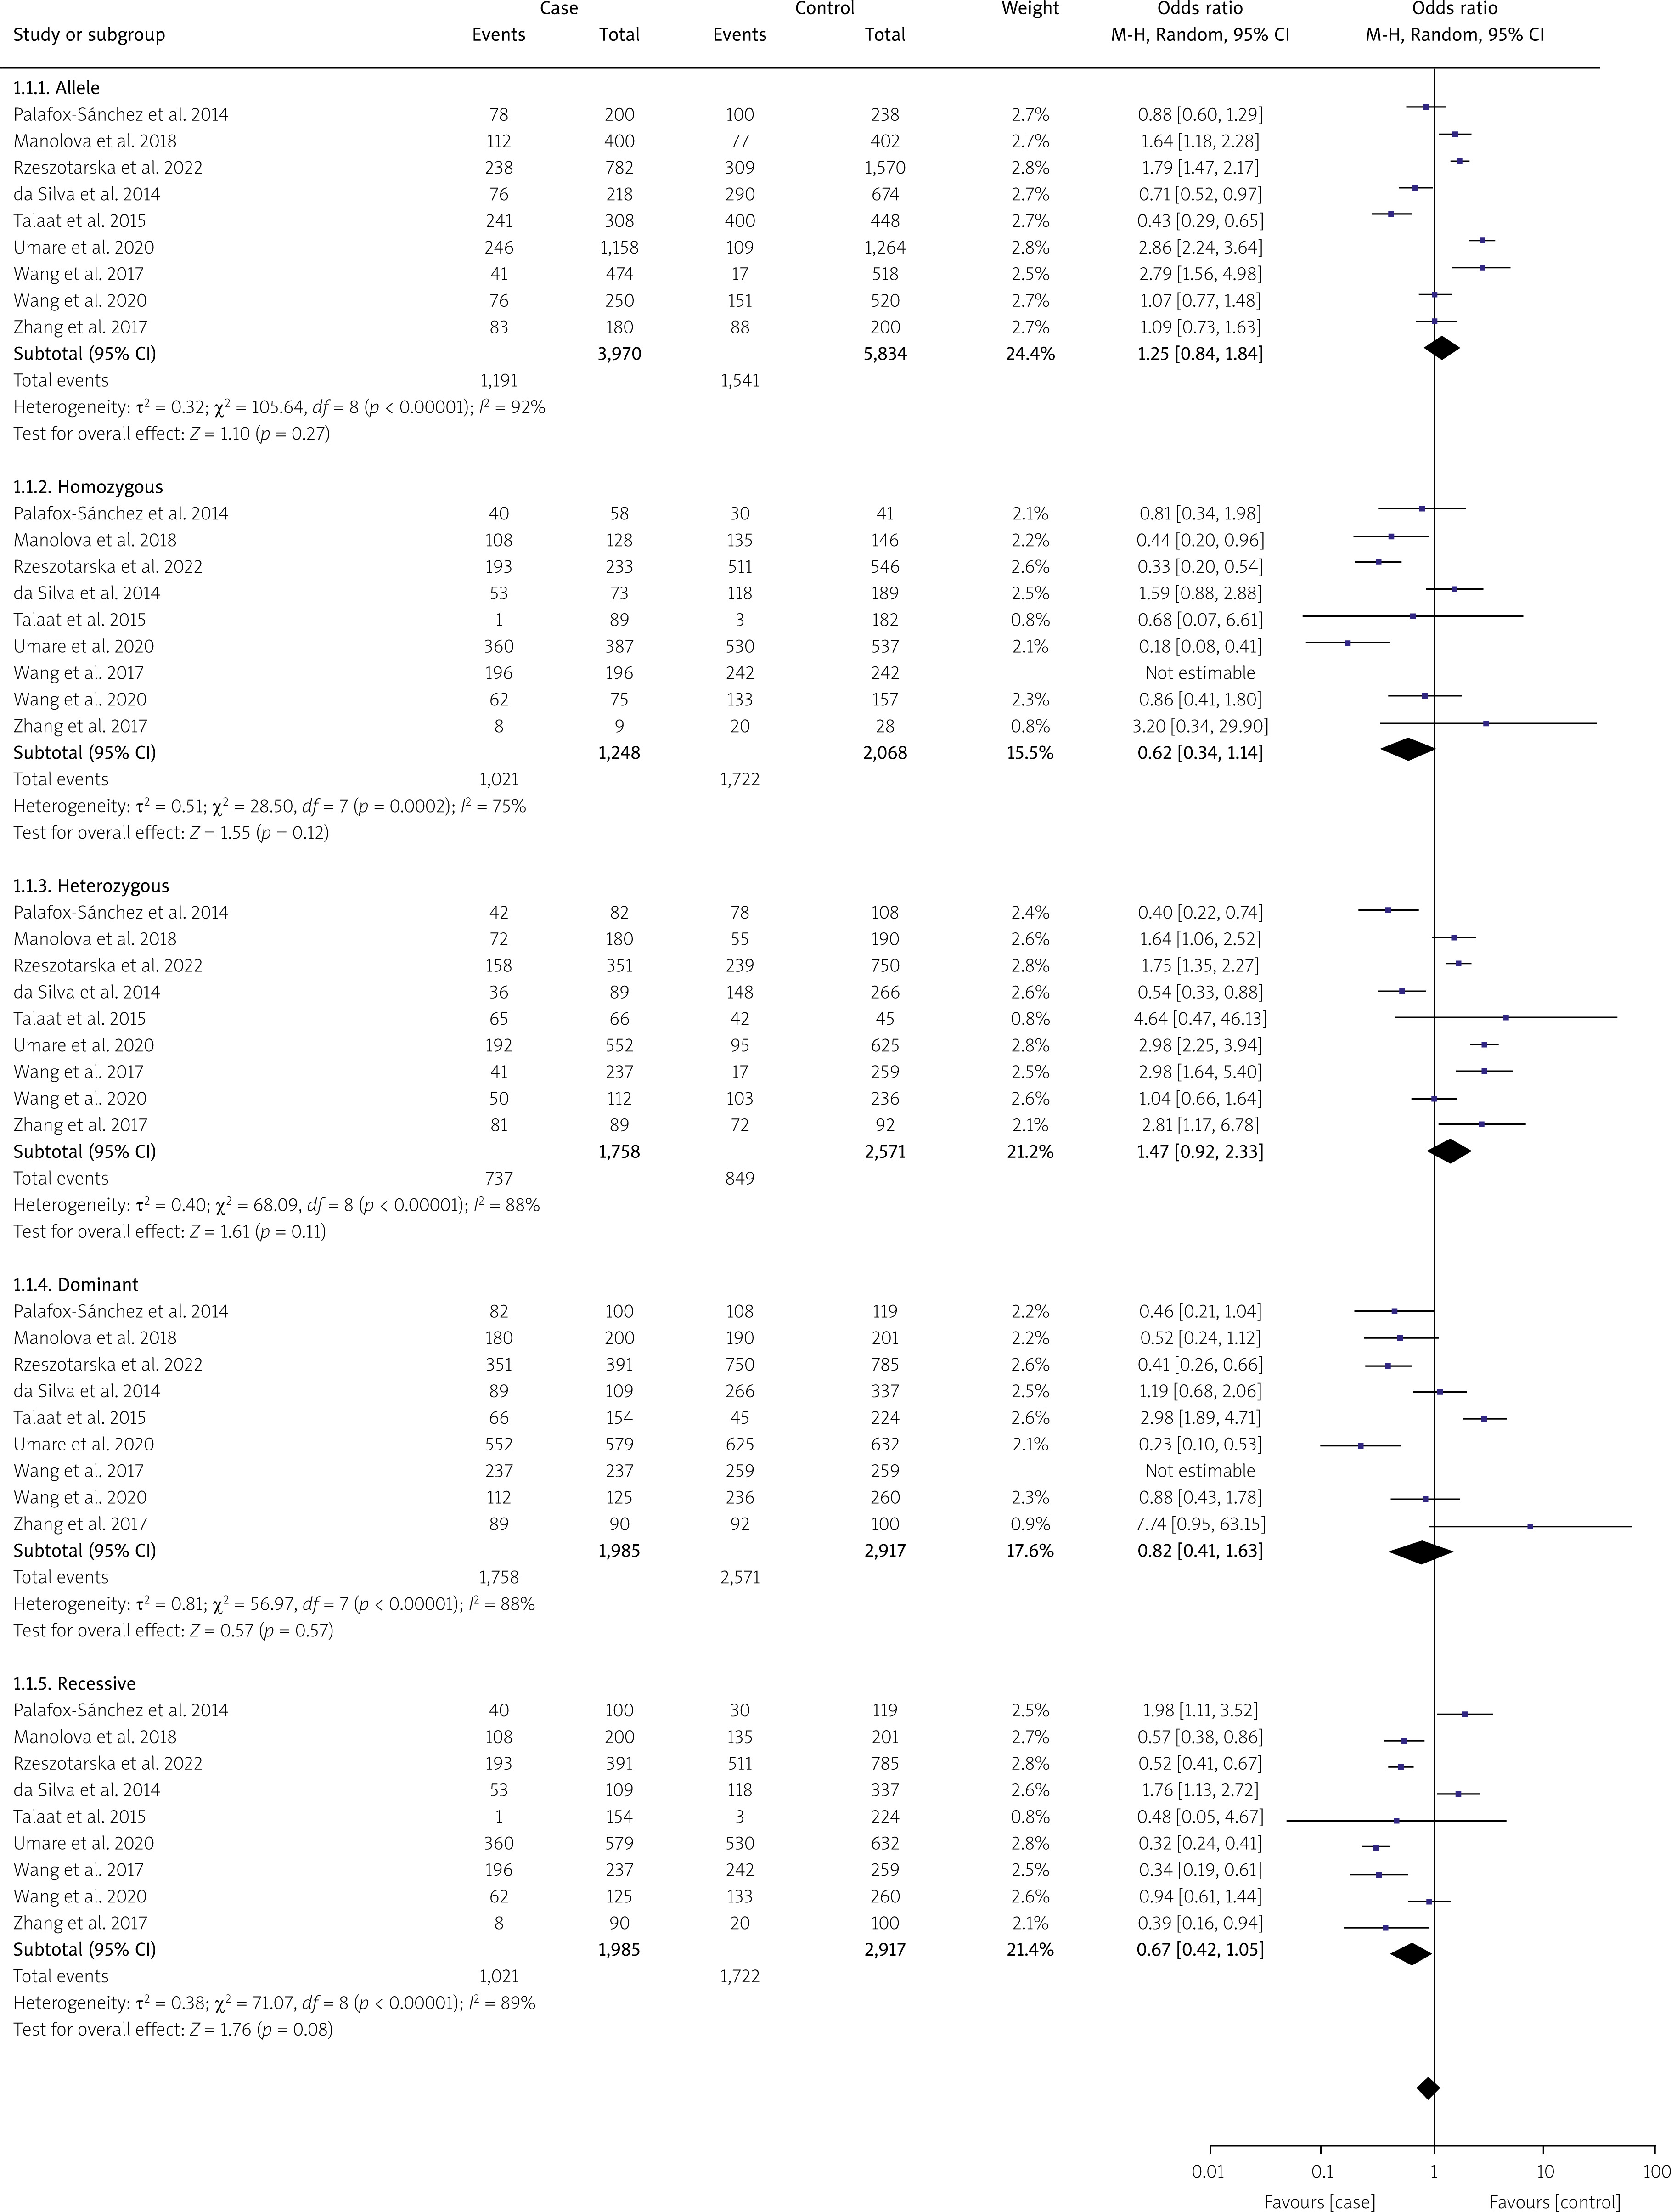
In this meta-analysis, genetic variants of TNF-α, specifically rs1800629, were selected for examination based on the analyzed genotypes. Their association with SLE was explored using multiple comparison models while considering HWE. The analyzed studies showed significant variability (I2 > 50%, p > 0.05). Nevertheless, a strong correlation between SLE and TNF-α was found in the two genetic models based on a random-effects model. In the allelic model G vs. A, OR = 0.64; 95% CI: 0.42–0.98; p < 0.04; I2 = 89%. In the dominant model GG + GA vs. AA, OR = 1.74; 95% CI: 1.07–2.84; p = 0.03; I2 = 87%. In contrast, the fixed-effects model analysis revealed a significant correlation between TNF-α and SLE in the heterozygote genetic model GA vs. AA: OR = 2.31, 95% CI: 1.57–3.40; p < 0.0001; I2 = 89%. In contrast, no significant correlation was found for the recessive model (OR = 1.48, 95% CI: 0.65–3.39, p = 0.36, I2 = 73%) or homozygote model GG vs. AA (OR = 1.85, 95% CI: 0.65–5.24; p = 0.25; Fig. 3). After conducting subgroup analyses of Caucasian and Asian populations, we discovered that the allelic model of Asian populations showed A: OR significant association (G vs. A: OR = 0.55, 95% CI: 0.3621–0.8512; p = 0.06), but not in the Caucasian group (G vs. A: OR = 0.7300, 95% CI: 0.34–1.53; p = 0.40) (Table II). The Circos plot showed various genomic features in a circular layout. From the outer to the inner circle, it displays chromatin states, annotated genes, histone modifications, transcription factors, a specific genetic variant (rs1800629), related SNPs (r2), and 3D chromatin interactions (Fig. 4).
Fig. 3
Forest plot showing an association between the TNF-α gene polymorphism and SLE risk in the genetic models.
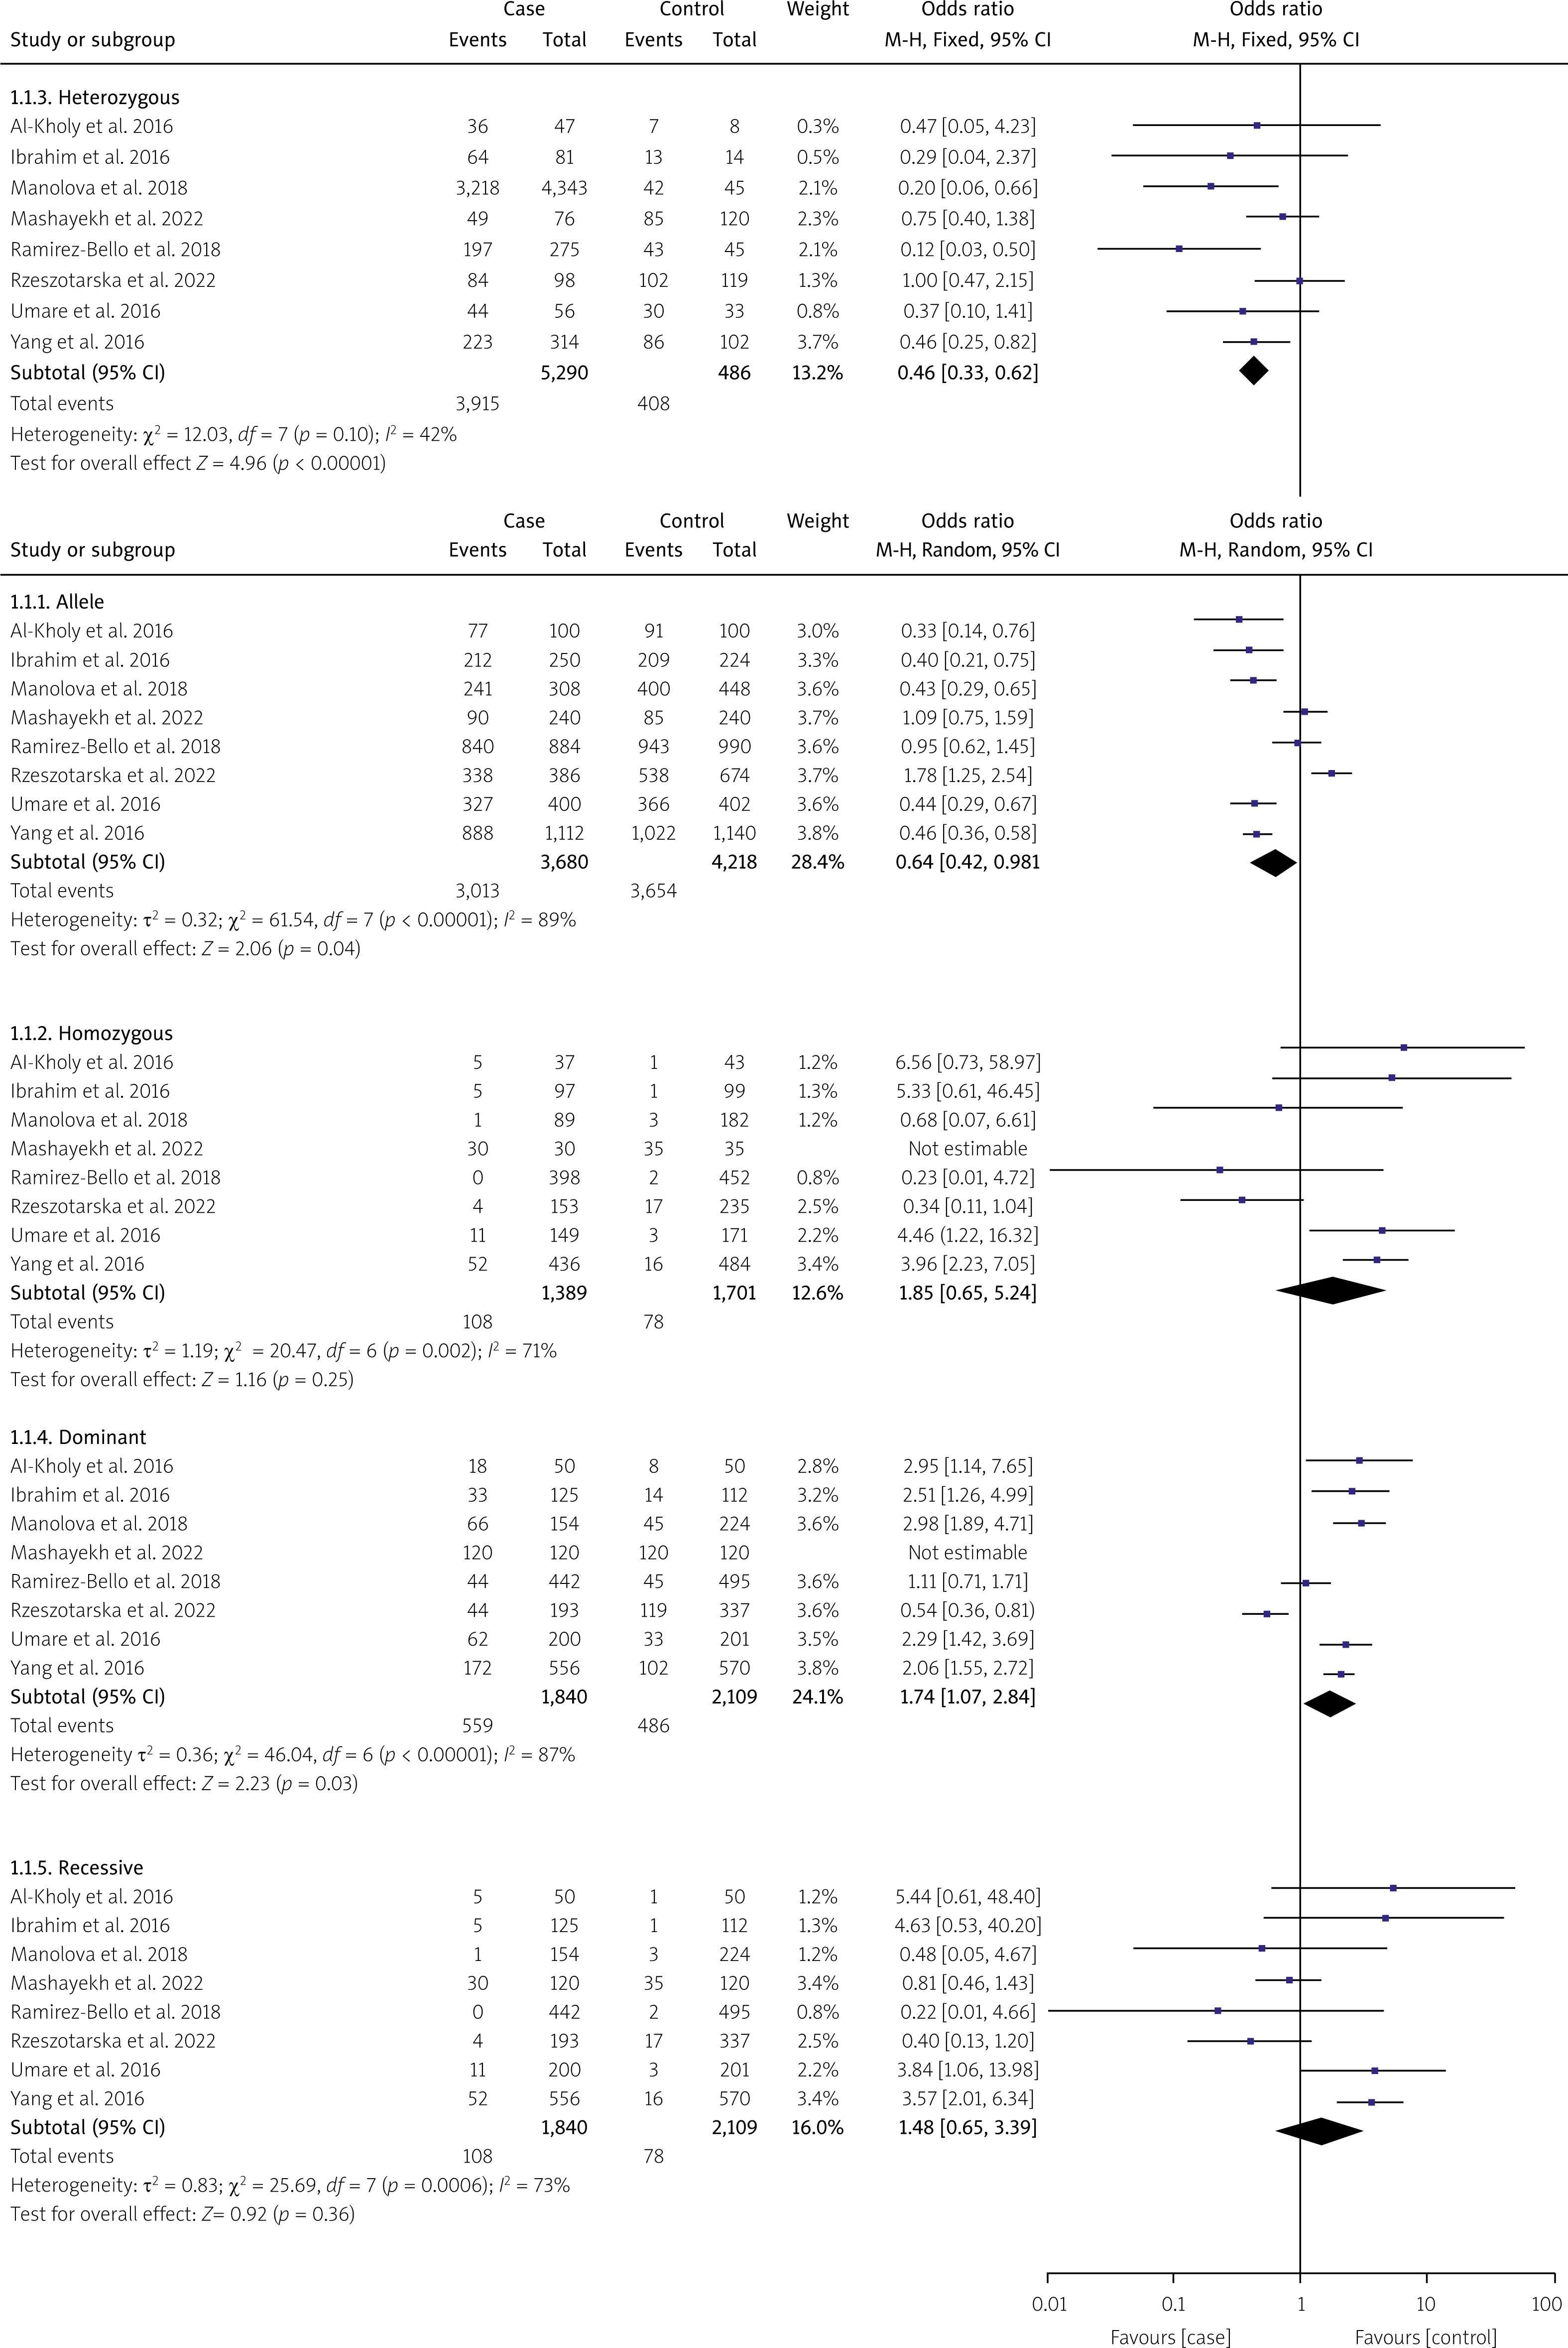
Table II
Subgroup analysis for TNF-α (rs1800629) gene polymorphism association with SLE risk
Nine studies were performed to assess IL-10 polymorphisms in SLE patients and controls. Based on the random effects model, the analysis demonstrated no significant association between IL-10 and SLE in any of the genetic models, including the allelic model (G vs. A), OR = 1.25, 95% CI: 0.84–1.84, p = 0.27, I2 = 92%; homozygote (GG vs. AA), OR = 0.62, 95% CI: 0.34–1.14, p = 0.12, I2 =75%; dominant (GG + GA vs. AA), OR = 0.82, 95% CI: 0.41–1.63, p = 0.57, I2 = 87%; heterozygote (GA vs. AA), OR = 1.47, 95% CI: 0.92–2.33, p = 0.11, I2 = 88%; and recessive model, OR = 0.67, 95% CI: 0.42–1.05, p = 0.08, I2 = 89% (see Figure 5). When ethnicity was considered, the dominant model in the Asian group showed a noteworthy correlation (GG/GA vs. AA: OR = 2.32, 95% CI: 1.72–3.13, p = 2.63e-08) but not in the Caucasian group (GG/GA vs. AA: OR = 0.77, 95% CI: 0.48–1.25, p = 0.30) (Table III). The Circos plot for rs1800896 is shown in Figure 4.
Table III
Subgroup analysis for IL-10 rs180089 gene polymorphism association with SLE risk
An examination of publication bias and sensitivity
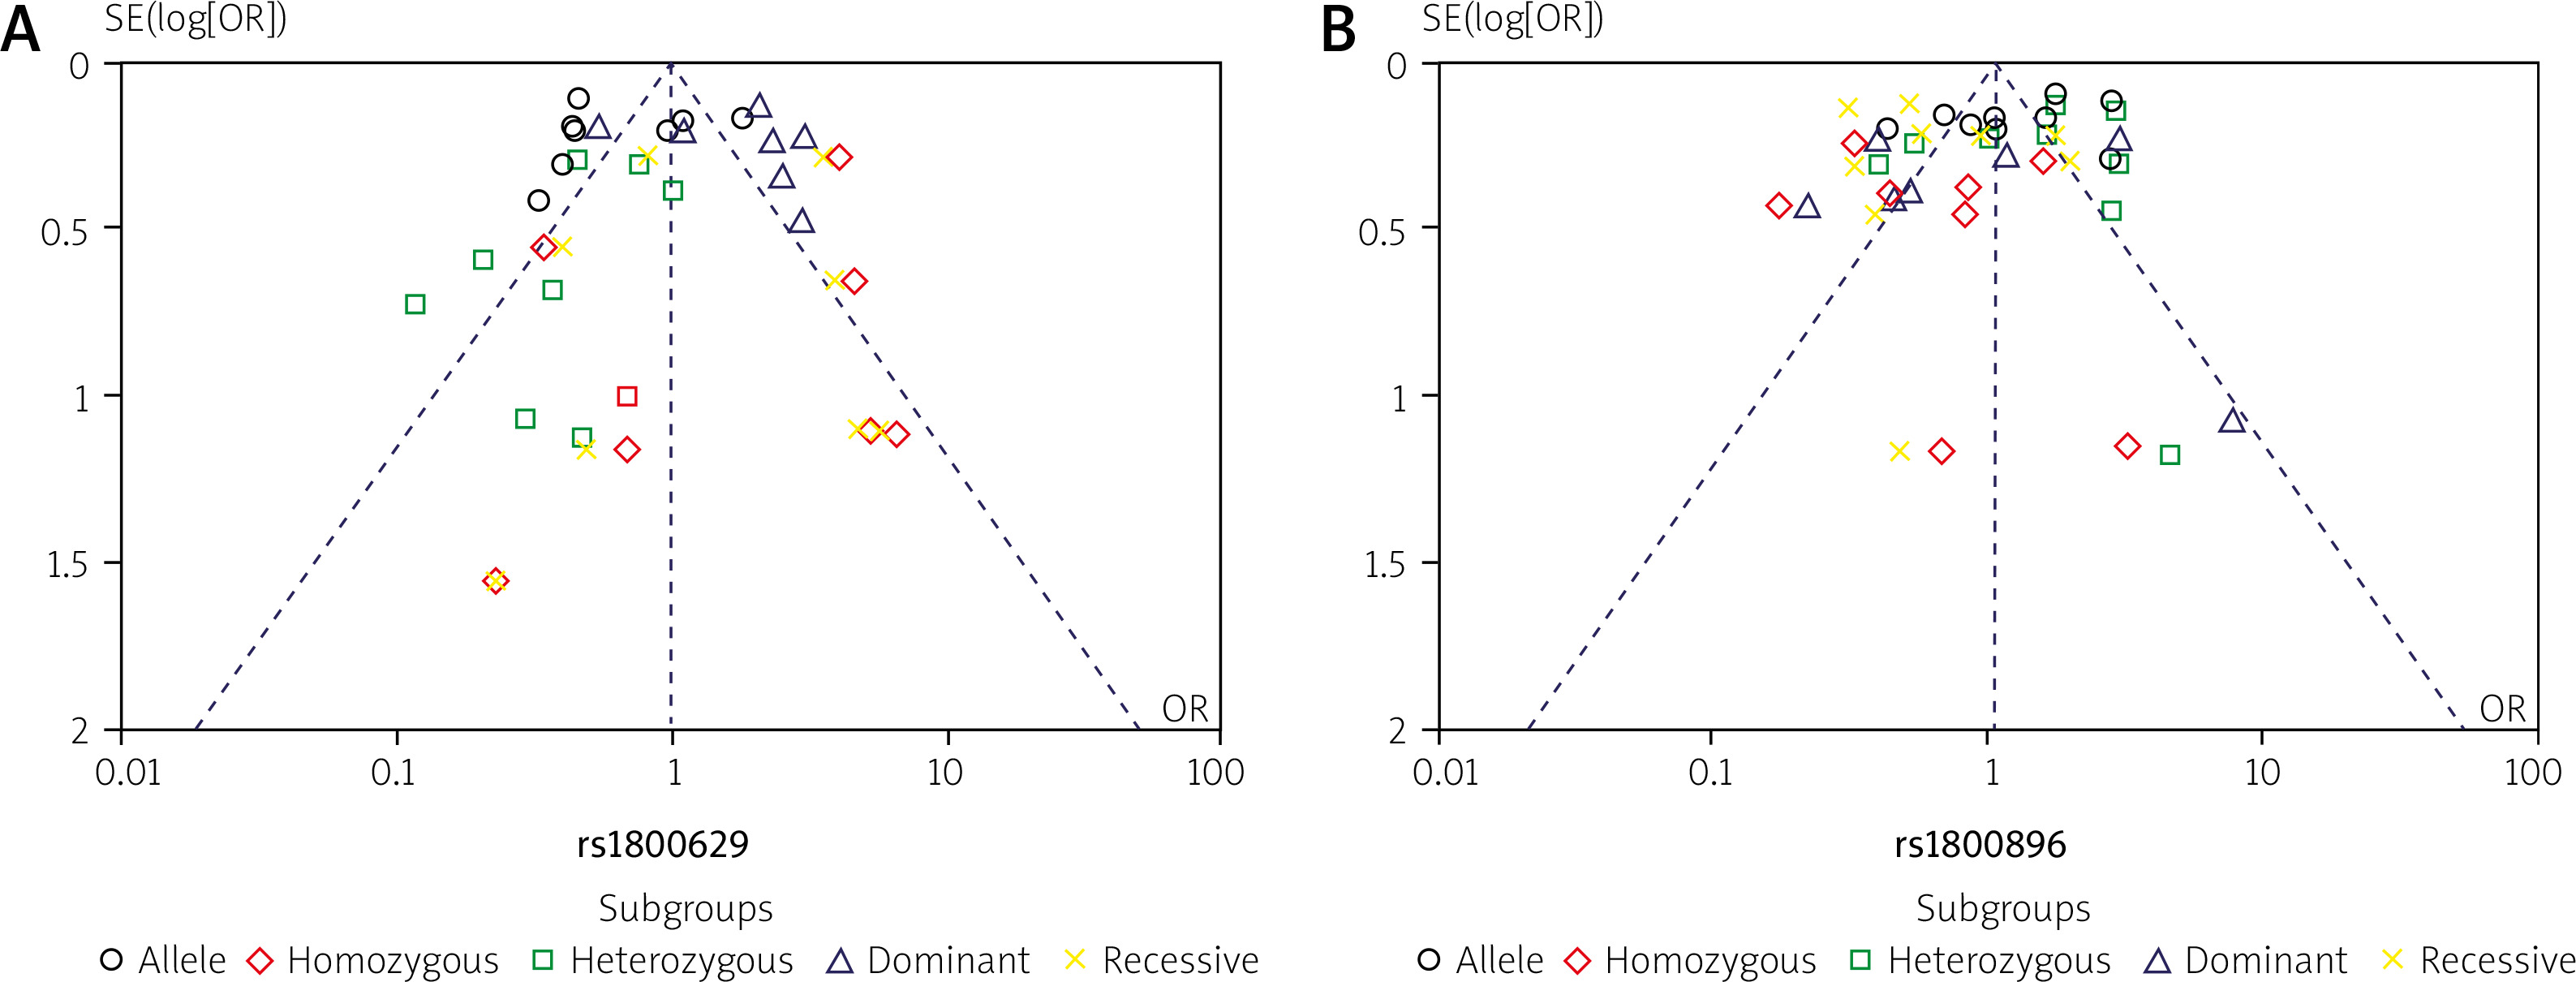
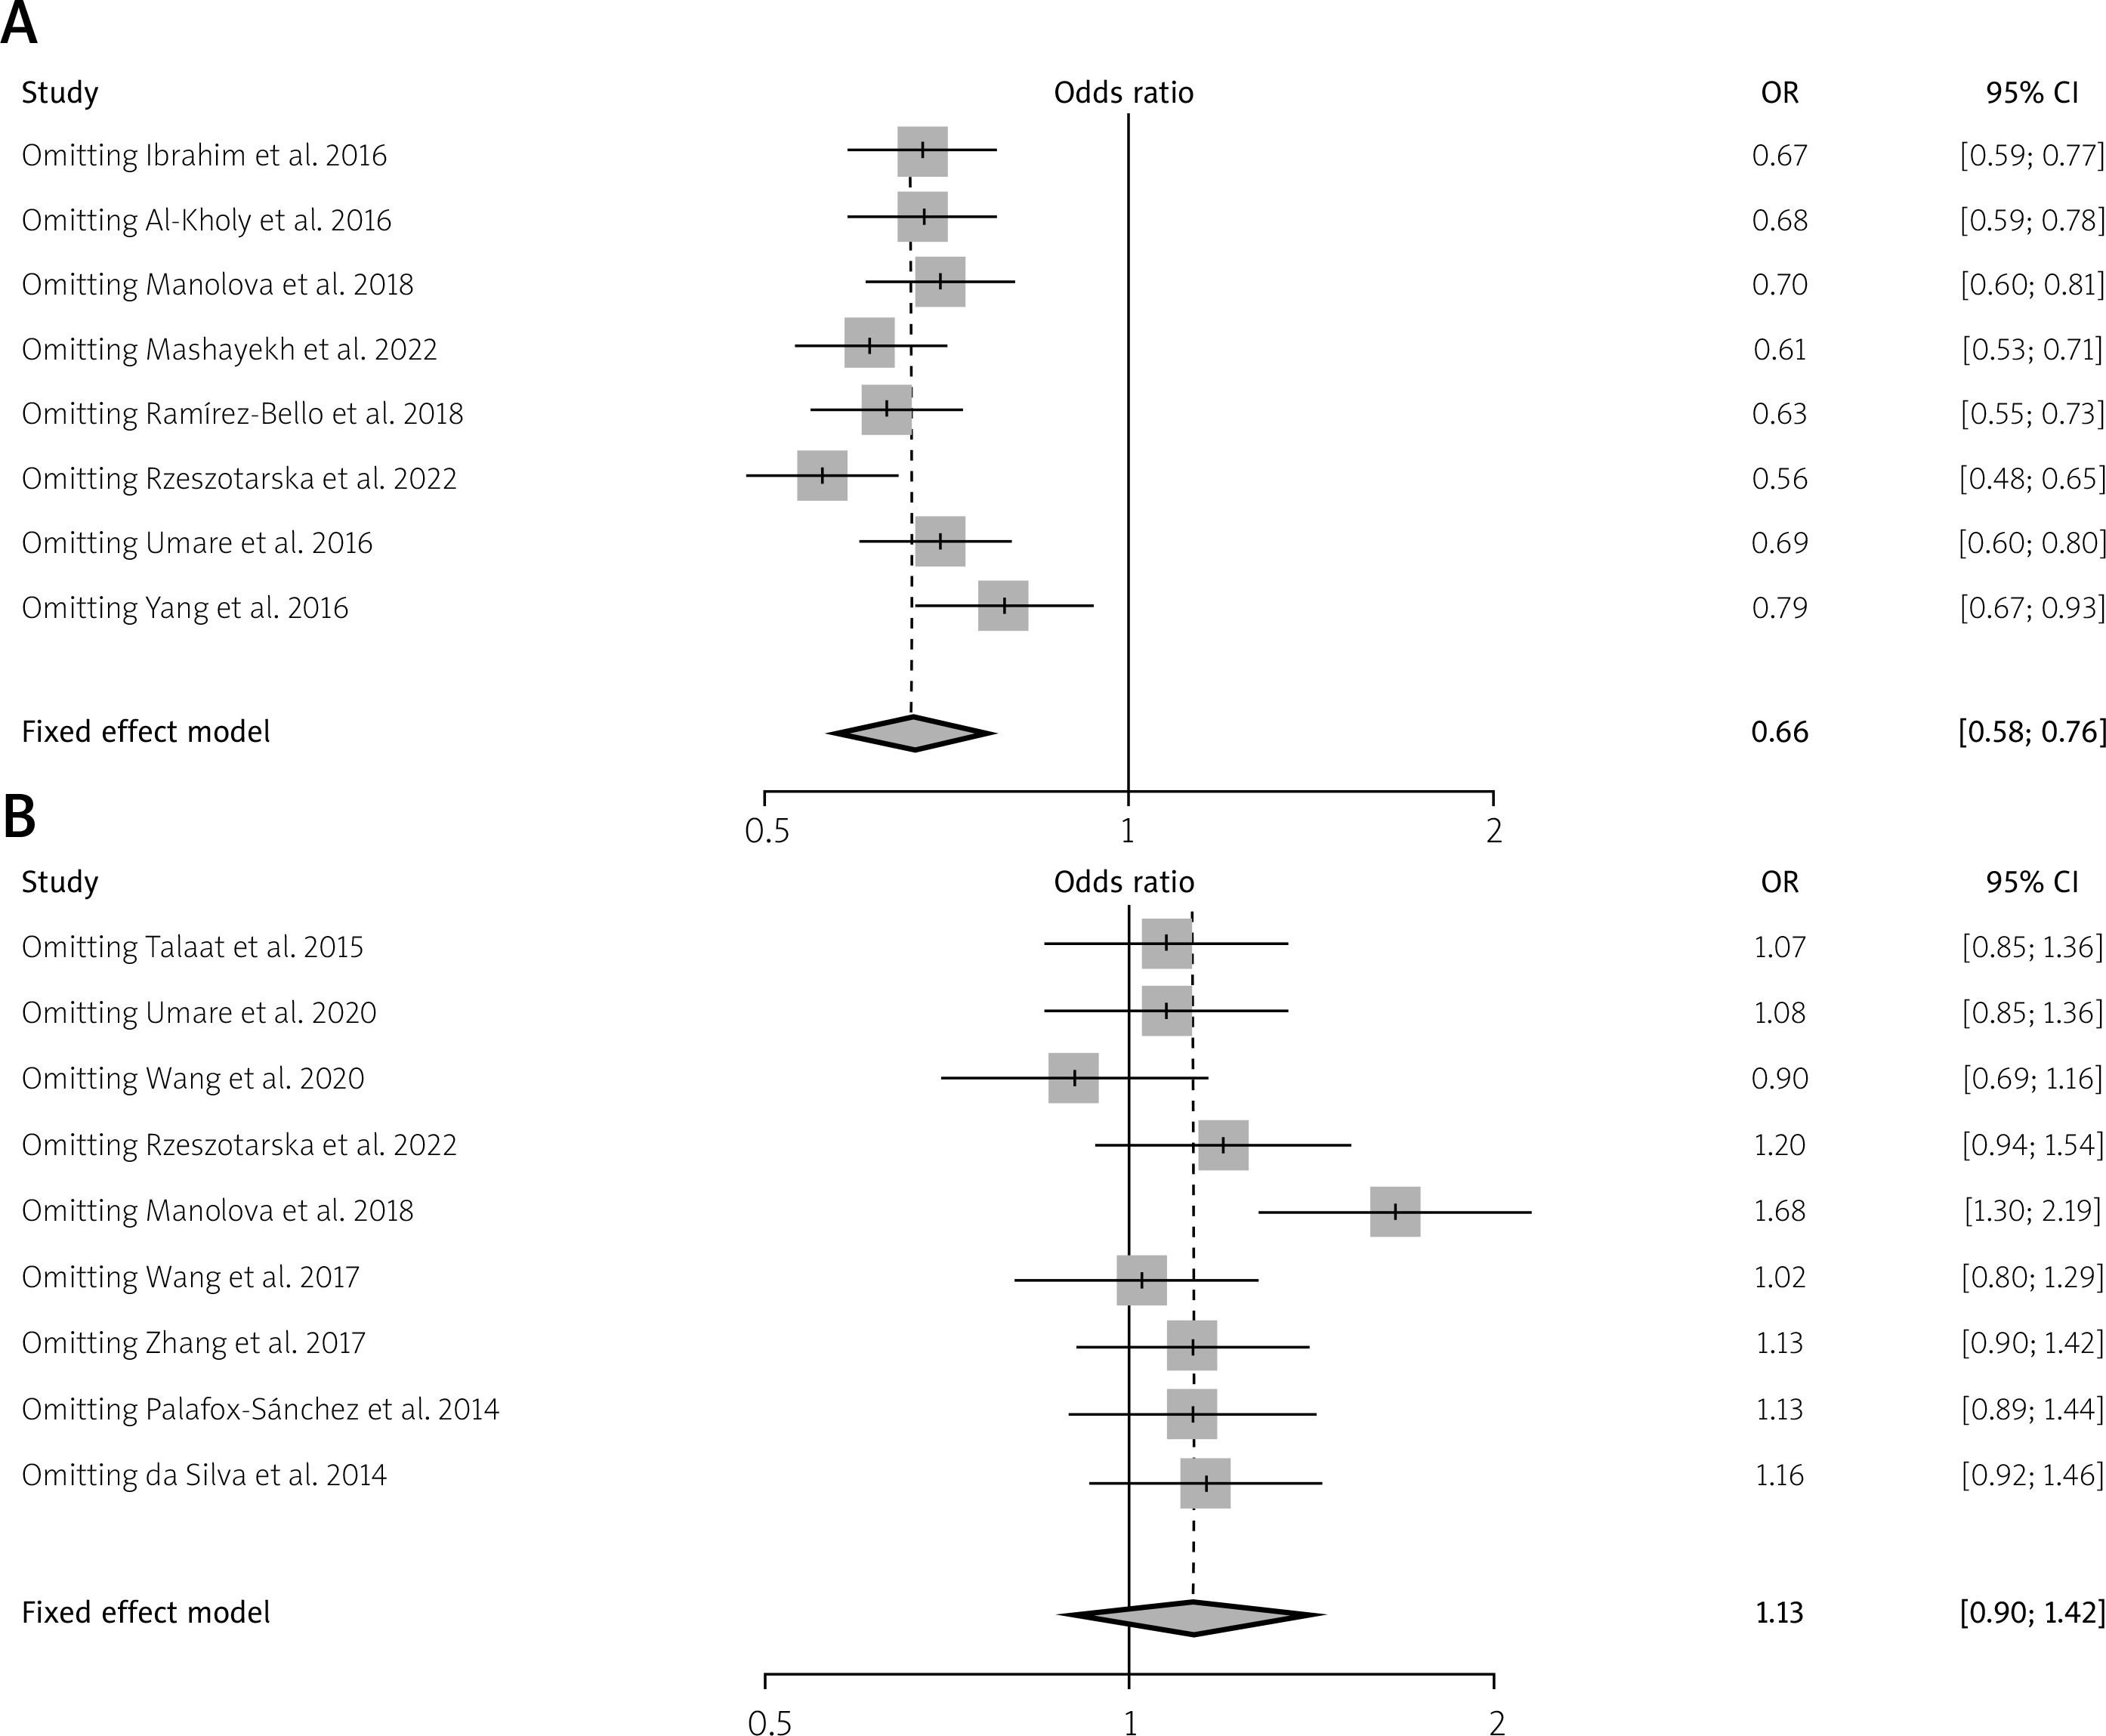
The distribution of plots illustrating TNF-α (rs1800629) and IL-10 (rs1800896) gene polymorphisms between patients with SLE and controls was examined to assess potential publication bias. For this analysis, a funnel plot and Egger’s test were used. However, Figure 6 shows no evidence of significant bias in this study. Additionally, a sensitivity analysis was performed for the genetic variants of TNF-α (rs1800629) and IL-10 (rs1800896), and the results consistently remained unchanged (Fig. 7). These findings are statistically robust, strengthening the conclusions.
Discussion
Systemic lupus erythematosus is an autoimmune disease that can harm several organs; however, the exact cause remains unclear. Despite exposure to the same environmental factors, individuals show varying degrees of susceptibility. Therefore, rheumatology researchers have begun to emphasize the role of genetic factors in the development of rheumatoid arthritis. Over the last decade, genome-wide association studies (GWAS) have uncovered numerous genetic loci associated with autoimmune disorders. More than 40 genetic markers have been linked to a higher risk of SLE [11]. According to GWAS data, the development of SLE may involve three key cellular pathways: lymphocytes, interferon signaling, and immune complex signaling [12]. This knowledge has deepened our understanding that genetic factors are just one component of the intricate mechanisms involved in the etiopathogenesis of SLE. There is growing interest in the study of gene polymorphisms associated with SLE. In this meta-analysis, we studied the correlation between two cytokine genes and two distinct genetic variants in 8,321 patients. Our co Tumor necrosis factor ααmprehensive findings suggest that TNF-α (-308 G/A) genes consistently correlate with SLE, but not with IL-10 (-1082G/A). Upon further analysis based on ethnicity, we observed a significant correlation between TNF-α (-308 G/A), genetic variations, and SLE risk in Asians.
Tumor necrosis factor α is a protein with various functions in the immune system, including stimulation of inflammatory cytokine production, activation of neutrophils, increase in the expression of adhesion molecules, and acting as a co-stimulator for antibody production and T-cell activation. Research has shown that TNF-α has beneficial effects that help to control autoimmunity. However, excessive TNF-α levels can exacerbate inflammation, which may contribute to autoimmune susceptibility and development [13]. Abnormal production of TNF-α has been implicated in several autoimmune diseases including SLE [14]. Therefore, genetic variants of TNF-α may affect susceptibility to SLE and its clinical manifestations. Our results are consistent with those of previous meta-analyses on the TNF-α (-308 G/A) polymorphism. However, our findings differ from those of a meta-analysis that reported no correlation between SLE risk and the TNF-α (-308 G/A) polymorphism. For instance, studies by Rzeszotarska et al. [15], Manolova et al. [16], Umare et al. [17], Al-Kholy et al. [18], Abdellatief et al. [19], Ramírez-Bello et al. [20], and Yang et al. [21] have confirmed this link in populations from China, Egypt, Mexico, and Iran. However, some studies have found no significant correlation between SLE and TNF-α polymorphisms, such as a study by Mashayekh et al. [22]. There was no association between the rs1800629 (-308 G/A) TNF-α promoter and increased SLE incidence in the Lor population.
Interleukin-10 is known for its anti-inflammatory properties, which are exerted through TNF α inhibition [23]. The IL-10 gene has a variation at position -1082 that affects the binding site of a transcription factor. This variation may alter the production and secretion of IL-10. Position-1082 has an A allele linked to reduced levels of IL-10 production and a G allele linked to increased levels of this cytokine [24]. The A allele (GA and AA) is related to low IL-10 production [25], which may increase the risk of developing SLE susceptibility owing to reduced IL-10 production. Our findings align with earlier meta-analyses regarding the IL-10 rs1800872 (-819 C/T) polymorphism. However, our findings diverge from those of another meta-analysis, which found a correlation between this gene and SLE risk. For example, Talaat et al. [26] found that individuals with AA and GG genotypes in the IL-10 -1082 polymorphism were more commonly observed among patients with SLE in the Egyptian population than in healthy individuals. However, Umare et al. [27] conducted a study that found that IL-10 1082G allele frequencies were significantly increased in SLE patients. The combined 1082AG + GG genotype frequency was considerably higher in the patient group. In addition, Rzeszotarska et al. [15] found that complement 4 (C4) levels were significantly higher in SLE patients with the AA genotype than in those with the AG + GG genotype (14.2 vs. 8.4; p = 0.042). Numerous studies have identified a significant correlation between SLE and IL-10 polymorphisms in various ethnic groups. For instance, studies by Hong Wang et al. [9], Manolova et al. [16], Wang et al. [28], Zhang et al. [29], Palafox-Sánchez et al. [30], and Silva et al. [31] found that IL-10 promoter polymorphisms significantly increased the risk of SLE.
A meta-analysis with a large sample size and heterogeneity is needed to better understand the relationship between TNF-α and IL-10 polymorphisms and SLE, as the existing results have led to differing conclusions. In a previous meta-analysis, Wang et al. [32] reported that individuals with the homozygous GG genotype had a significantly higher risk of SLE among Asian populations than carriers of the variant A allele. They concluded that the IL-10 rs1800896 polymorphism increases the risk of SLE. However, the present study showed no association between IL-10 1082G polymorphisms and SLE in any of these comparisons. Our findings align with those of Chen et al. [33], who reported increased frequencies of the CC genotype and decreased frequencies of the AA genotype in a Latin American population.
In our study, we discovered significant differences in the overall population concerning TNF-α rs1800629 (-308 G/A) and IL-10 rs1800872 (-819 C/T) across five genetic models. We performed subgroup analyses based on genotyping methods and ethnicity to explore the sources of these variances but found they did not account for the differences. It is important to note that our study included only published research, which may have introduced bias. We also identified publication bias, as only published studies were included in our meta-analysis. However, our sensitivity analyses confirmed the robustness of our findings, as the results remained consistent even when individual studies were excluded. Compared to other meta-analyses, our sample sizes were significantly larger for both the TNF-α rs1800629 (-308 G/A) and IL-10 rs1800872 (-819 C/T) polymorphisms. Additionally, we conducted comprehensive literature searches in electronic databases using a highly sensitive method.
These findings have important implications for clinical practice. Genetic screening for TNF-α rs1800629 (-308 G/A) and IL-10 rs1800872 (-819 C/T) polymorphisms could improve risk assessment and personalized management of SLE. By identifying individuals with genetic predispositions, clinicians can customize preconception and treatment plans to better address individual risk factors.
Study limitations
It is crucial to acknowledge the limitations of the study. First, the SLE disease phenotype and susceptibility factors may be heterogeneous, as it is a complex disease. Second, the meta-analysis included only eight or nine studies, which may limit the estimation power of the current study owing to an insufficient number of available publications. Third, publication bias may have affected the analysis because unfavorable results may not have been published. Although Egger’s test was performed, it was impossible to rule out bias completely. Fourth, the meta-analysis was based on retrospective research and was influenced by the methodological flaws of the included studies. Moreover, the absence of individual raw data limited our ability to explore gene-environment and gene-gene interactions or assess the impact of other polymorphisms and cytokines in our analysis.
Conclusions
The present study suggests that there is no association between IL-10 1082G polymorphisms and SLE, but the G/A polymorphism of TNF-α-308 is associated with SLE, especially in individuals of Asian descent. However, this conclusion should be interpreted cautiously because of the low statistical power and considerable heterogeneity. Further research is required to examine the association between these polymorphisms and susceptibility to SLE in various demographic groups, and more detailed information on age and sex is needed to validate our results.