
Introduction
Juvenile dermatomyositis (JDM) is the most common inflammatory myopathy in childhood and represents an autoimmune systemic vasculopathy. In addition to typical muscle and skin manifestations, it can affect the gastrointestinal, cardiovascular, and pulmonary systems, potentially leading to serious complications. Although its aetiopathogenesis remains unclear, infections and environmental triggers are thought to play a role in genetically predisposed individuals [1, 2].
Juvenile dermatomyositis is a heterogeneous disease with varying courses, including monophasic patterns with relapse and remission or persistently active disease [3]. Identifying phenotypic clusters may help in planning individualised treatment, improving disease prognosis, and enhancing patients’ quality of life.
In recent years, myositis autoantibodies have been utilised to better identify the disease and predict prognosis in approximately 40% of paediatric patients. These autoantibodies are classified into 2 groups: myositis-associated antibodies (MAAs) and myositis-specific antibodies (MSAs). Myositis-specific antibodies target the cytoplasmic or nuclear components of muscle cells and are highly specific to inflammatory myopathies, whereas MAAs can also be present in other autoimmune diseases. A strong association between these autoantibodies and distinct clinical phenotypes has been established [4].
This study aimed to analyse and identify phenotypic clusters by examining laboratory findings and MSAs in patients with various clinical signs and symptoms, including nailfold capillaroscopy (NFC) findings where available.
Material and methods
This study employed a retrospective design and involved JDM patients diagnosed between 1998 and 2023. The study was conducted in 14 referral Paediatric Rheumatology Departments in Turkey. These centres, known for their high disease prevalence and comprehensive patient data, include Dokuz Eylul University, Hacettepe University, Istanbul University, Istanbul University Cerrahpasa Medical School, Ankara Integrated Health Campus, Umraniye Research and Training Hospital, University of Health Sciences, Uludag University, Gazi University, Kocaeli University, Karadeniz Technical University, Malatya Training and Research Hospital, Istanbul Medeniyet University, Pamukkale University, and University of Health Sciences Dr. Behcet Uz Children’s Disease and Paediatric Surgery Training and Research Hospital.
Study population
Data from all JDM patients at the aforementioned centres were collected. The diagnosis of JDM was based on Bohan and Peter’s criteria [5, 6]. Patients with overlap syndromes, juvenile polymyositis, and other inflammatory myopathies were excluded from the study.
Data collection
A standardised data collection form was created and sent to all participating centres. Demographic, clinical, and laboratory data were retrospectively extracted from patient files and hospital electronic record systems. Data covered the entire follow-up period. Demographic data included sex, age at symptom onset, age at diagnosis, and follow-up duration. Clinical findings included constitutional symptoms, musculoskeletal symptoms, skin symptoms, interstitial lung disease, gastrointestinal symptoms, laboratory values for muscle enzymes at diagnosis, erythrocyte sedimentation rate (ESR), antinuclear antibody, MAA, MSA, NFC findings, Childhood Myositis Assessment Scale (CMAS) score, and treatment strategies. Interstitial lung disease was identified by high-resolution computed tomography and pulmonary function tests. Pulse glucocorticosteroid (GC) therapy was defined as 10–30 mg/kg/day per dose. Abnormal laboratory values were defined as follows: creatine kinase (CK) > 145 U/l, aspartate aminotransferase (AST) > 35 U/l, lactate dehydrogenase (LDH) > 360 U/l, and ESR > 20 mm/h. Antinuclear antibody testing was performed using the indirect immunofluorescence method, with titres of 1/80 or above considered positive. Myositis-associated antibodies (anti-polymyositis/systemic scleroderma [PM-Scl], anti-ribonucleoprotein/Smith antigen complex [RNP-SM], anti-topoisomerase 1 [SCL70], Ku, centromere protein [CENP]) and MSA (antinuclear matrix protein 2 [NXP2], anti-melanoma differentiation-associated protein 5 [MDA5], anti-transcription intermediary factor 1 [TIF1], anti-complex nucleosome remodeling histone deacetylase [Mi-2], anti-small ubiquitin-like modifier activating enzyme [SAE], anti-cytosolic 5’-nucleotidase 1 A [CN1A], and anti-synthetase antibodies) were analysed by immunoblot. Nailfold capillaroscopy findings were recorded as normal, non-scleroderma pattern, or scleroderma pattern, based on the standardised evaluation table from the EULAR Microcirculation Working Group in Rheumatological Diseases [7].
Data analysis
In the absence of class labels, unsupervised methods are useful for classification problems that can guide treatment and diagnosis. The most common of these methods is cluster analysis, which aims to classify observations with similar characteristics. In this study, hierarchical cluster analysis was used for classification [8]. Categorical variables in the original dataset were expressed as 0 or 1. Since these variables are interrelated and may have different weights and significance, clustering was performed using categorical principal components analysis (CATPCA), which checks both the weights of numerical data and the interaction between variables; CATPCA aims to reduce the original set of variables to a smaller set of independent components that capture most of the information from the original variables. This technique allows for more efficient interpretation of relationships between multiple variables. After performing CATPCA, cluster analysis was carried out on the independent variables. No interaction between variables was observed. Descriptive statistics were used to present categorical variables as numbers and percentages, and continuous variables as “mean” for normally distributed data or “min-max” for skewed distributions.
Variable selection and data preprocessing
Variables were converted to categorical form before analysis. Features with fewer than 5 observations were excluded. For example, cardiac manifestations were excluded due to low sample size, with only 3 patients showing systolic dysfunction, one with diastolic dysfunction, and one with pericardial effusion. In cases where both a group and its subgroups were present with the same result, only the subgroup was included. For example, of gastrointestinal involvement and dysphagia, only dysphagia was included in the analysis. Data with more than 30% missing information were excluded from the analysis. Thus, 23 variables, including fatigue, fever, weight loss, muscle weakness, myalgia, arthritis/ arthralgia, heliotrope rash, Gottron’s papules, photosensitivity, malar rash, Shawl sign, Raynaud’s phenomenon, cutaneous ulcers, calcinosis, lipodystrophy, interstitial lung disease, dysphagia, elevated CK at diagnosis, elevated AST at diagnosis, elevated LDH at diagnosis, elevated ESR at diagnosis, CMAS < 15 at diagnosis, and pulse GC treatment, were included in the cluster analysis.
Cluster prediction
Using the independent variables derived from CATPCA, agglomerative hierarchical cluster analysis was applied. The agglomerative algorithm is a clustering method based on a tree from leaf to root. The agglomerative algorithm clusters observations are based on Euclidean distance, first grouping the closest observations. Clusters were produced using the agglomerative hierarchical clustering method, also based on Euclidean distance. The Ward method was chosen to minimise intra-cluster variance. The optimal number of clusters was determined using the dendrogram obtained from hierarchical clustering based on CATPCA. The variance within clusters was assessed on a case-by-case basis. The optimal number of clusters was determined by integrating clinical insights, specifically identifying the point at which case heterogeneity emerged.
Statistical analysis between clusters
Due to the unbalanced “n” between groups and the limited number of continuous variables, the Kruskal-Wallis test was used to assess differences in autoantibodies, NFC findings, and treatments across clusters. Additionally, χ2 analysis was performed to confirm group characteristics using dummy variables (e.g. group 1 vs. others, group 2 vs. others, etc.).
Results
A total of 176 JDM patients, including 115 females (65.3%), were included in the study. The median age at symptom onset was 7 years (range: 0–16), the median age at diagnosis was 8 years (range: 1–17), and the median follow-up period was 35 months (range: 0–186). All patients exhibited cutaneous manifestations. Muscle weakness (91.5%) and heliotrope rash (83.5%) were the most common clinical features. Elevated CK levels were present in 124 patients (70.5%) at the time of diagnosis, with a median CK value of 407 U/l (range: 9–29,445) (Table I).
Table I
Clinical and laboratory characteristics of the patients (n = 176)
| Variable | Patients |
|---|---|
| Demographic characteristics | |
| Sex (female) [n (%)] | 115 (65.3) |
| Age at symptom onseta [year] | 7 (0–16) |
| Age at diagnosisa [year] | 8 (1–17) |
| Delay in diagnosisa [month] | 3 (0–186) |
| Follow-up timea [month] | 35 (0–157) |
| Clinical features | |
| Fatigue [n (%)] | 134 (76.1) |
| Fever [n (%)] | 40 (22.7) |
| Weight loss [n (%)] | 37 (21.0) |
| Musculoskeletal symptom [n (%)] | 167 (94.9) |
| Muscle weakness [n (%)] | 161 (91.5) |
| Myalgia [n (%)] | 136 (77.3) |
| Arthritis-arthralgia [n (%)] | 52 (29.5) |
| Heliotrope rash [n (%)] | 147 (83.5) |
| Gottron’s papules [n (%)] | 140 (79.5) |
| Photosensitivity [n (%)] | 70 (39.8) |
| Malar rash [n (%)] | 102 (58.0) |
| Shawl sign [n (%)] | 19 (10.8) |
| Raynaud’s phenomenon [n (%)] | 28 (15.9) |
| Cutaneous ulcer [n (%)] | 13 (7.4) |
| Calcinosis [n (%)] | 59 (33.5) |
| Lipodystrophy [n (%)] | 16 (9.1) |
| Interstitial lung disease [n (%)] | 21 (11.9) |
| Dysphagia [n (%)] | 8 (4.5) |
| Laboratory values | |
| EMG | 72/94 (76.6) |
| Muscle MRI | 82/97 (84.5) |
| Muscle biopsy | 62/72 (86.1) |
| CK valuea [U/l] | 407 (9–29445) |
| AST valuea [U/l] | 70 (12–874) |
| LDH valuea [U/l] | 484 (24–2289) |
| ESR valuea [mm/h] | 15 (2–165) |
| CMAS scorea | 32 (0–52) |
| ANA positivity [n (%)] | 87/158 (55.1) |
| MAA positivity [n (%)] | 30/132 (22.7) |
| MAA negativity [n (%)] | 102/132 (77.2) |
| PM-Scl [n (%)] | 13 (9.8) |
| RNP/RNP-SM [n (%)] | 5 (3.8) |
| Ro52 [n (%)] | 6 (4.5) |
| Ku [n (%)] | 4 (3.0) |
| SCL70 [n (%)] | 1 (0.8) |
| CENP [n (%)] | 2 (1.5) |
| MSA positivity [n (%)] | 75/115 (65.2) |
| MSA negativity [n (%)] | 40/115 (34.7) |
| NXP2 [n (%)] | 30/115 (26.1) |
| TIF1 [n (%)] | 24/115 (20.9) |
| MDA5 [n (%)] | 13/115 (11.3) |
| Anti-ARS [n (%)] | 11/115 (9.6) |
| Mi-2 [n (%)] | 10/115 (8.7) |
| SAE [n (%)] | 1/115 (0.9) |
| CN1A [n (%)] | 1/115 (0.9) |
| NFC [n (%)] | 87 (49.4) |
| Normal NFC findings [n (%)] | 19/87 (21.8) |
| Scleroderma pattern [n (%)] | 44/87 (50.6) |
| Non-scleroderma pattern [n (%)] | 24/87 (27.6) |
| Treatment | |
| Pulse GC [n (%)] | 113 (64.2) |
| Intravenous immunoglobulin [n (%)] | 93 (52.8) |
| Hydroxychloroquine [n (%)] | 73 (41.5) |
| Cyclophosphamide [n (%)] | 29 (16.5) |
| Mycophenolate mofetil [n (%)] | 44 (25.0) |
| Cyclosporine [n (%)] | 25 (14.2) |
| Azathioprine [n (%)] | 4 (2.3) |
| Tofacitinib [n (%)] | 16 (9.1) |
| Bisphosphonate [n (%)] | 8 (4.5) |
| Biologic treatment [n (%)] | 42 (23.9) |
ANA – antinuclear antibody, AST – aspartate aminotransferase, CENP – centromere protein, CK – creatine kinase, CMAS – Childhood Myositis Assessment Scale, CN1A – anti-cytosolic 5’-nucleotidase 1 A, EMG – electromyography, ESR – erythrocyte sedimentation rate, GC – glucocorticosteroid, LDH – lactate dehydrogenase, MAA – myositis-associated antibodies, MDA5 – anti-melanoma differentiation-associated protein 5, Mi-2 – anti-complex nucleosome remodeling histone deacetylase antibodies, MRI – magnetic resonance imaging, MSA – myositis-specific antibodies, NFC – nailfold capillaroscopy, NXP2 – antinuclear matrix protein 2, PM-Scl – anti-polymyositis/systemic scleroderma antibodies, RNP – anti-ribonucleoprotein antigen antibodies, RNP-SM – anti-ribonucleoprotein/Smith antigen complex antibodies, SAE – anti-small ubiquitin-like modifier activating enzyme, SCL70 – anti-topoisomerase 1 antibodies, TIF1 – anti-transcription intermediary factor 1.
Nailfold capillaroscopy was performed in 87 patients (49.4%). Among these, 19 (21.8%) had a normal capillaroscopy pattern, 44 (50.5%) had a scleroderma pattern, and 24 (27.5%) had a non-scleroderma pattern.
Myositis-associated antibodies results were available for 132 patients (75.0%). Among them, 30 patients (22.7%) tested positive for MAA, while 102 patients (77.2%) tested negative. The most frequently detected MAA was PM-Scl (9.8%). Five patients exhibited multiple MAA positivity: PM-Scl + Ro52 in one patient, PM-Scl + Ku in two patients, PM-Scl + CENP in one patient, and RNP + Ro52 in one patient.
Myositis-specific antibodies results were available for 115 patients (65.3%). Of these, 75 patients (65.2%) tested positive for MSA, and 40 patients (34.7%) tested negative. The most frequently observed MSAs were NXP2 antibodies (26.1%) and TIF1 antibodies (20.9%). Ten patients showed multiple MSA positivity: TIF1 + Mi-2 in one patient, Mi-2 + SAE in one patient, CN1A + ARS in one patient, TIF1 + ARS in one patient, NXP2 + ARS in two patients, MDA5 + Mi-2 in two patients, NXP2 + Mi-2 in one patient, and TIF1 + MDA5 + ARS in one patient.
Pulse GC therapy was administered to 113 patients, and intravenous immunoglobulin (IVIG) therapy was administered to 93 patients. Biologic therapy was administered to 42 patients. Among them, 31 patients received TNF inhibitors, 12 received rituximab, 5 received tocilizumab, and 2 received abatacept.
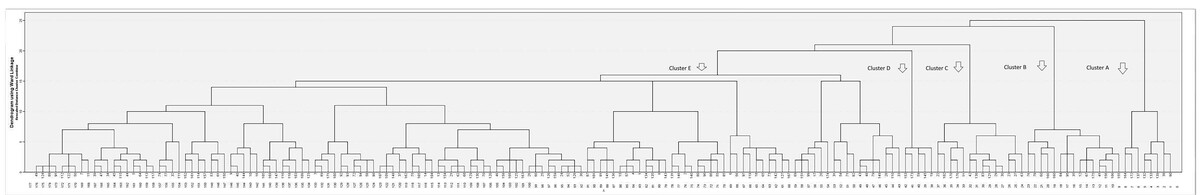
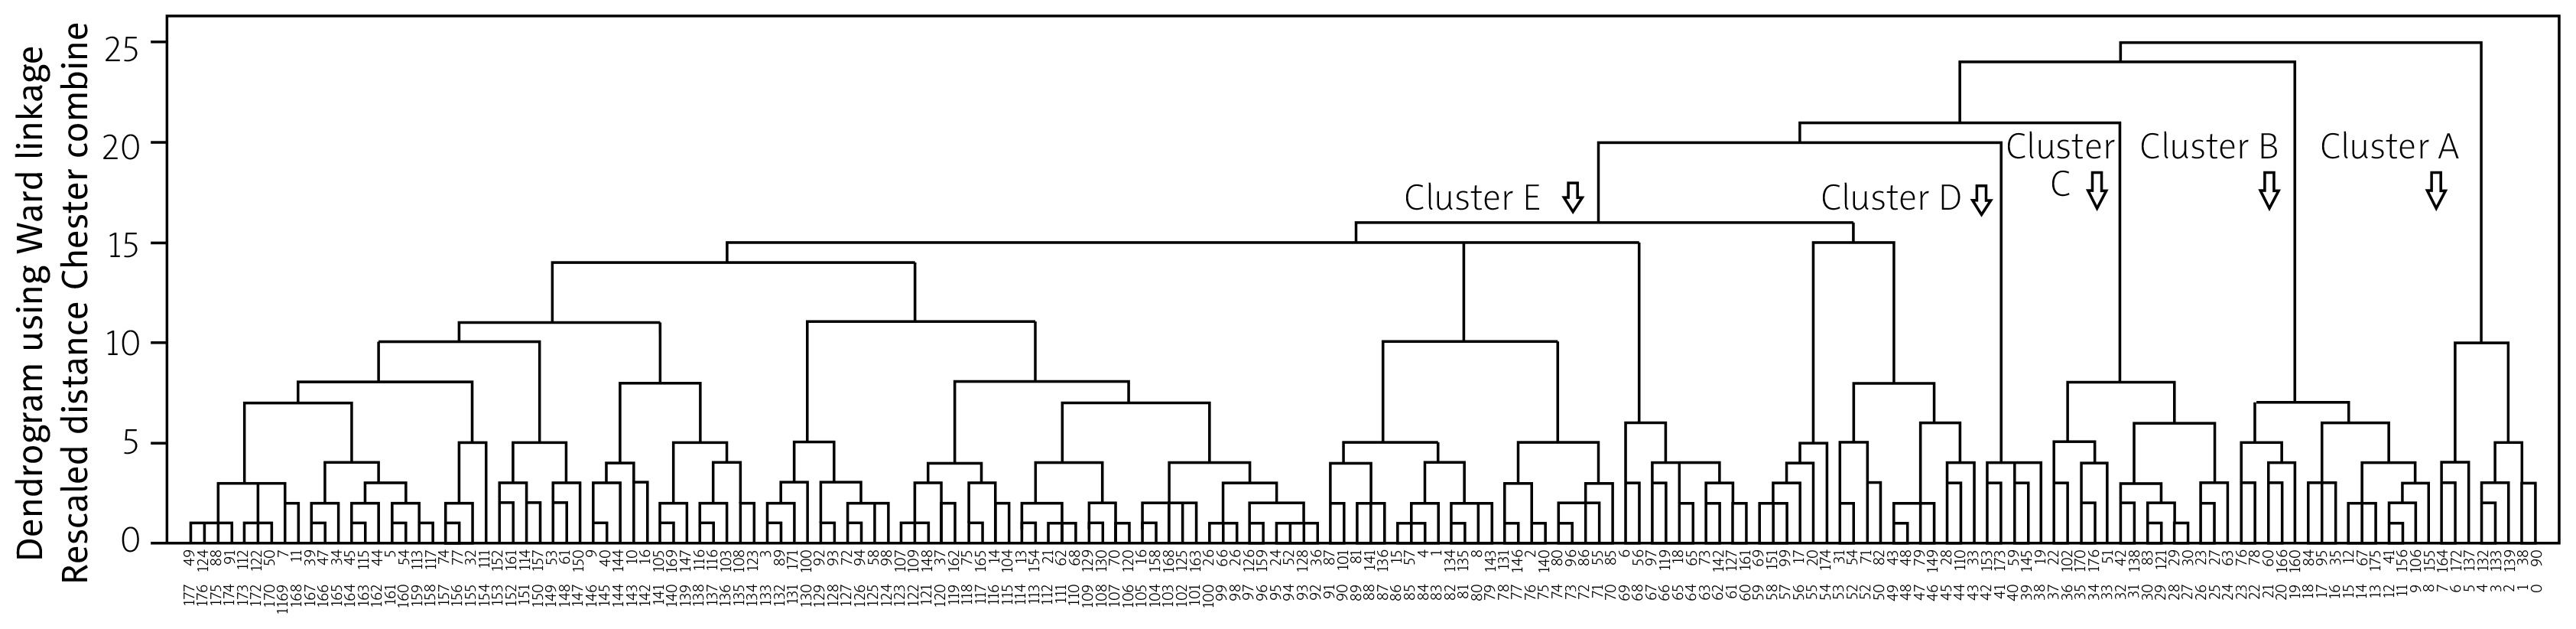
When CATPCA analysis was performed on these 23 categorical variables, 23 independent components of the same dimension were obtained. The first 9 of these components explained 57.8% of the variance. Using the new weights from the CATPCA analysis, a new matrix structure was created for hierarchical cluster analysis. The dendrogram from the agglomerative hierarchical cluster analysis is shown in Figure 1, and 5 optimal clusters were identified (Table II).
Table II
Clinical and laboratory features and comparison of 5 clusters identified by PCA-based agglomerative cluster analysis
| Features [n (%)] | Cluster A n = 8 | Cluster B n = 12 | Cluster C n = 33 | Cluster D n = 10 | Cluster E n = 113 | p |
|---|---|---|---|---|---|---|
| Sex (female) [n (%)] | 6 (75.0) | 6 (50.0) | 24 (72.7) | 6 (60.0) | 73 (64.6) | 0.640 |
| Age at symptom onseta [years] | 11 (2–15) | 7 (3-16) | 7 (1–15) | 4 (1–12) | 7 (0–16) | 0.148 |
| Age at diagnosisa [years] | 11.5 (2–15) | 8 (4–17) | 8 (1–16) | 4 (1–12) | 8 (1–17) | 0.102 |
| Delay in diagnosisa [months] | 1 (0–4) | 8.5 (2–86) | 2 (0–129) | 2 (0–4) | 3 (0–186) | 0.018* |
| Follow-up timea [months] | 13.5 (6–64) | 22 (0–86) | 32 (0–144) | 69 (1–130) | 36 (1–157) | 0.035 |
| Fatigue [n (%)] | 5 (62.5) | 3 (25.0) | 29 (87.9) | 8 (80.0) | 89 (78.8) | < 0.001 |
| Fever [n (%)] | 1 (12.5) | 1 (8.3) | 11 (33.3) | 3 (30.0) | 24 (21.2) | 0.349 |
| Weight loss [n (%)] | 3 (37.5) | 2 (16.7) | 9 (27.3) | 1 (10.0) | 22 (19.5) | 0.538 |
| Muscle weakness [n (%)] | 8 (100) | 0 | 32 (97.0) | 9 (90.0) | 112 (99.1) | < 0.001 |
| Myalgia [n (%)] | 6 (75.0) | 4 (33.3) | 30 (90.9) | 7 (70.0) | 89 (78.8) | 0.002 |
| Arthritis-arthralgia [n (%)] | 2 (25.0) | 2 (16.7) | 12 (36.4) | 4 (40.0) | 32 (28.3) | 0.666 |
| Heliotrope rash [n (%)] | 7 (87.5) | 8 (66.7) | 29 (87.9) | 9 (90.0) | 94 (83.2) | 0.503 |
| Gottron’s papules [n (%)] | 7 (87.5) | 11 (91.7) | 28 (84.8) | 9 (90.0) | 85 (75.2) | 0.415 |
| Photosensitivity [n (%)] | 2 (25.0) | 9 (75.0) | 18 (54.5) | 4 (40.0) | 37 (32.7) | 0.015 |
| Malar rash [n (%)] | 7 (87.5) | 9 (75.0) | 21 (63.6) | 7 (70.0) | 58 (51.3) | 0.118 |
| Shawl sign [n (%)] | 1 (12.5) | 2 (16.7) | 15 (45.5) | 1 (10.0) | 0 | < 0.001 |
| Raynaud’s phenomenon [n (%)] | 4 (50.0) | 3 (25.0) | 7 (21.2) | 1 (10.0) | 13 (11.5) | 0.036 |
| Cutaneous ulcer [n (%)] | 0 | 0 | 12 (36.4) | 0 | 1 (0.9) | < 0.001 |
| Calcinosis [n (%)] | 1 (12.5) | 2 (16.7) | 18 (54.5) | 6 (60.0) | 32 (28.3) | 0.007 |
| Lipodystrophy [n (%)] | 0 | 0 | 4 (12.1) | 10 (100) | 2 (1.8) | < 0.001 |
| Interstitial lung disease [n (%)] | 2 (25.0) | 0 | 16 (48.5) | 0 | 3 (2.7) | < 0.001 |
| Dysphagia [n (%)] | 8 (100) | 0 | 0 | 0 | 0 | < 0.001 |
| CK valuea [U/l] | 678 (141–6221) | 127 (24–1077) | 241 (21–17000) | 510 (47–16000) | 656 (9–29445) | 0.038 |
| AST valuea [U/l] | 98 (80–538) | 28 (13–216) | 50 (12–731) | 96 (26–525) | 75 (15–874) | 0.018** |
| LDH valuea [U/i] | 532 (218–971) | 263 (179–543) | 440 (189–2197) | 752 (24–1560) | 498 (101–2289) | 0.002*** |
| ESR valuea [mm/h] | 19.5 (3–72) | 11 (2–67) | 16 (2–165) | 19 (2–114) | 15 (2–82) | 0.714 |
| CMAS scorea | 8 (0–41) | 52 (41–52) | 34 (4–52) | 26 (7–52) | 31 (5–52) | < 0.001**** |
| At diagnosis CMAS ≤ 15 [n (%)] | 5 (62.5) | 1 (8.3) | 5 (15.2) | 4 (40.0) | 24 (21.2) | 0.020 |
| MAA positivity [n (%)] | 1/5 (20.0) | 1/9 (11.1) | 4/27 (14.8) | 0/9 | 24/82 (29.3) | 0.176 |
| PM-Scl [n (%)] | 1/5 (20.0) | 1/9 (11.1) | 2/27 (7.4) | 0/9 | 9/82 (11.0) | 0.609 |
| RNP/RNP-SM [n (%)] | 1/5 (20.0) | 0/9 | 0/27 | 0/9 | 4/82 (4.9) | 0.227 |
| Ro52 [n (%)] | 0/5 | 0/9 | 0/27 | 0/9 | 6/82 (7.3) | 0.429 |
| Ku [n (%)] | 0/5 | 0/9 | 0/27 | 0/9 | 4/82 (4.9) | 0.642 |
| SCL70 [n (%)] | 0/5 | 0/9 | 1/27 (3.7) | 0/9 | 0/82 | 0.417 |
| CENP [n (%)] | 0/5 | 0/9 | 0/27 | 0/9 | 2/82 (2.4) | 0.872 |
| MSA positivity [n (%)] | 4/5 (80.0) | 3/7 (42.9) | 19/24 (79.2) | 3/7 (42.9) | 46/72 (63.9) | 0.224 |
| NXP2 [n (%)] | 4/5 (80.0) | 1/7 (14.3) | 7/24 (29.2) | 1/7 (14.3) | 17/72 (26.6) | 0.064 |
| TIF1 [n (%)] | 1/5 (20.0) | 1/7 (14.3) | 7/24 (29.2) | 2/7 (28.6) | 13/72 (18.1) | 0.776 |
| MDA5 [n (%)] | 1/5 (20.0) | 1/7 (14.3) | 2/24 (8.3) | 0/7 | 9/72 (12.5) | 0.801 |
| Mi-2 [n (%)] | 0/5 | 1/7 (14.3) | 2/24 (8.3) | 0/7 | 7/72 (9.7) | 0.823 |
| SAE [n (%)] | 0/5 | 0/7 | 0/24 | 0/7 | 1/72 (1.4) | 0.963 |
| ARS [n (%)] | 0/5 | 0/7 | 3/24 (12.3) | 0/7 | 8/72 (11.1) | 0.654 |
| CN1A [n (%)] | 0/5 | 0/7 | 0/24 | 0/7 | 1 (1.4) | 0.963 |
| Normal NFC findings [n (%)] n = 19 (21.8) | 0/3 | 1/4 (25.0) | 5/22 (22.7) | 1/6 (16.7) | 12/52 (23.0) | 0.908 |
| Scleroderma pattern [n (%)] n = 44 (50.5) | 1/3 (33.3) | 1/4 (25.0) | 15/22 (68.2) | 3/6 (50.0) | 24/52 (46.2) | 0.338 |
| Non-scleroderma pattern [n (%)] n = 24 (27.6) | 2/3 (66.7) | 2/4 (50.0) | 2/22 (9.1) | 2/6 (33.3) | 16/52 (30.8) | 0.115 |
| Pulse GC [n (%)] | 8 (100) | 2 (16.7) | 22 (66.7) | 7 (70.0) | 74 (65.5) | 0.002 |
| Intravenous immunoglobulin [n (%)] | 7 (87.5) | 3 (25.0) | 24 (72.7) | 6 (60.0) | 53 (46.9) | 0.006 |
| Hydroxychloroquine [n (%)] | 4 (50.0) | 5 (41.7) | 14 (42.4) | 6 (60.0) | 44 (38.9) | 0.742 |
| Cyclophosphamide [n (%)] | 4 (50.0) | 0 | 8 (24.2) | 2 (20.0) | 15 (13.3) | 0.024 |
| Mycophenolate mofetil [n (%)] | 1 (12.5) | 3 (25.0) | 11 (33.3) | 2 (20.0) | 27 (23.9) | 0.718 |
| Cyclosporine [n (%)] | 3 (37.5) | 1 (8.3) | 8 (24.2) | 1 (10.0) | 12 (10.6) | 0.093 |
| Azathioprine [n (%)] | 0 | 0 | 2 (6.1) | 0 | 2 (1.8) | 0.565 |
| Tofacitinib [n (%)] | 0 | 0 | 4 (12.1) | 2 (20.0) | 10 (8.8) | 0.432 |
| Bisphosphonate [n (%)] | 0 | 0 | 4 (12.1) | 1 (10.0) | 3 (2.7) | 0.139 |
| Biologic treatment [n (%)] | 3 (37.5) | 0 | 9 (27.3) | 3 (30.0) | 27 (23.9) | 0.287 |
ANA – antinuclear antibody, AST – aspartate aminotransferase, CENP – centromere protein, CK – creatine kinase, CMAS – Childhood Myositis Assessment Scale, CN1A – anti-cytosolic 5’-nucleotidase 1 A, EMG – electromyography, ESR – erythrocyte sedimentation rate, GC – glucocorticosteroid, LDH – lactate dehydrogenase, MAA – myositis-associated antibodies, MDA5 – anti-melanoma differentiation-associated protein 5, Mi-2 – anti-complex nucleosome remodeling histone deacetylase antibodies, MRI – magnetic resonance imaging, MSA – myositis-specific antibodies, NFC – nailfold capillaroscopy, NXP2 – antinuclear matrix protein 2, PM-Scl – anti-polymyositis/systemic scleroderma antibodies, RNP – anti-ribonucleoprotein antigen antibodies, RNP-SM – anti-ribonucleoprotein/Smith antigen complex antibodies, SAE – anti-small ubiquitin-like modifier activating enzyme, SCL70 – anti-topoisomerase 1 antibodies, TIF1 – anti-transcription intermediary factor 1.
Fig. 1
The dendrogram obtained by agglomerative hierarchical cluster analysis and CATPCA. The horizontal axis shows the patients, and the vertical axis shows the clustering distance. In this method, each individual initially forms a separate cluster. Subsequently, the 2 most similar clusters are merged in an iterative process, which continues until all data points are grouped into a single overarching cluster.
Cluster A (n = 8): “Patients with severe muscle weakness and oesophageal involvement requiring intensive immunosuppressive treatment”
In this group, all patients exhibited muscle weakness, dysphagia, and elevated CK levels at diagnosis. All patients received pulse GC therapy. The number of patients with a CMAS score below 15 at diagnosis was higher in this group than in the other clusters (p = 0.020). Raynaud’s phenomenon was present in 4 patients (50%), more frequently than in the other clusters (p = 0.036). Antinuclear matrix protein 2 antibody positivity was found in 4 of 5 patients (80%) tested for MSAs. Among the 3 patients with NFC results, 33.3% had a scleroderma pattern and 66.7% had a non-scleroderma pattern. The number of patients receiving cyclophosphamide was higher than in the other clusters (p = 0.024).
Cluster B (n = 12): “Amyopathic/hypomyopathic patients”
None of the patients in this group had muscle weakness. Photosensitivity was observed in 75% of patients, more frequently than in the other clusters (p = 0.015). Fatigue was less common compared to other groups (p < 0.001). The CMAS score at diagnosis was higher than in all other groups (p < 0.001). Autoantibody positivity was observed in 3 of 7 patients (42.9%) tested for MSAs, with NXP2, TIF1, MDA5, and Mi-2 being identified. Nailfold capillaroscopy was available in 4 patients, 50% of whom had a non-scleroderma pattern. No patient in this cluster received cyclophosphamide. Pulse GC and IVIG treatments were less common compared to other clusters (p = 0.002 and p = 0.006, respectively).
Cluster C (n = 33): “Patients with skin manifestations and lung involvement”
Lung involvement was more frequent in this group than in the other clusters (p < 0.001). Cutaneous ulcers and calcinosis were also more common in this group (p < 0.001 and p = 0.007, respectively). Fatigue, muscle weakness, and myalgia were common. Autoantibody positivity was detected in 79.2% of the 24 patients tested for MSAs, including NXP2, TIF1, MDA5, Mi-2, and ARS antibodies. The scleroderma pattern (68.2%) was the most common NFC finding.
Cluster D (n = 10): “Patients with complicated skin manifestations”
Calcinosis and lipodystrophy were more frequent in this group compared to other clusters (p = 0.007 and p < 0.001, respectively). Fatigue, muscle weakness, and typical skin manifestations were common. Autoantibody positivity was observed in 42.9% of 7 patients tested for MSAs, with NXP2 and TIF1 being identified. Nailfold capillaroscopy was available in 6 patients, 50% of whom had a scleroderma pattern.
Cluster E (n = 113): “Classic juvenile dermatomyositis: Patients with muscle weakness and typical skin manifestations”
This group had the highest number of patients. Typical cutaneous manifestations and muscle weakness were observed, with minimal organ involvement. Myositis-specific antibodies results were available in 72 patients, and 63.9% were autoantibody positive. Positive MSAs included NXP2, TIF1, MDA5, Mi-2, ARS, SAE, and CN1A. Nailfold capillaroscopy was available in 52 patients; 46.2% had a scleroderma pattern, 30.8% had a non-scleroderma pattern, and 23.1% had a normal capillaroscopy pattern.
Discussion
In this study, 5 phenotypic clusters were identified using a CATPCA-based hierarchical cluster analysis of 23 categorical variables in 176 JDM patients. These clusters were interpreted as follows: Cluster A with severe muscle weakness and oesophageal involvement requiring intensive immunosuppressive treatment; Cluster B with amyopathic/hypomyopathic patients; Cluster C with skin manifestations and lung involvement; Cluster D with complicated skin manifestations; and Cluster E with classic JDM. Identifying these clusters provides valuable insights not only for prognosis but also for guiding individualised treatment.
Hierarchical cluster analysis is widely used in different studies on rheumatic diseases in both adult and paediatric patients. This method has been utilised to characterise fever patterns in Still’s disease [9], to identify comorbidities in autoimmune diseases [10], to predict similarities between rheumatic diseases [11], to classify connective tissue diseases [12], and to delineate symptom clusters in fibromyalgia [13].
There have been 2 single-centre studies – one in adult and one in paediatric DM – that applied CATPCA-based hierarchical cluster analysis. In the adult DM study, 6 subgroups were identified: classical DM patients; amyopathic/hypomyopathic patients with interstitial lung disease (ILD) and skin ulcers; patients with significant lung, muscle, and skin involvement; patients with severe cardiomyopathy; patients with malignancy; and patients with other connective tissue diseases [14]. In the paediatric JDM study, 4 subgroups were identified: patients with arthralgia and intense inflammation; patients with clinical signs of vasculitis; hypermyopathic patients; and patients with skin involvement [15]. The clusters identified in these studies show both similarities and differences, which may be due to the variability in clinical features among patient groups. This variability can be attributed to differences in genetic and environmental factors influencing disease pathophysiology. Additionally, in this study, the multicentre design and nationwide data collection contributed to the diversity in disease presentation and the larger patient sample size.
In Cluster A (patients with severe muscle weakness and oesophageal involvement requiring intensive immunosuppressive therapy), all patients had muscle weakness, dysphagia, and elevated CK levels at diagnosis, and received pulse GC therapy. The CMAS values at diagnosis were lower compared to other clusters, and typical skin manifestations such as malar rash were common. Anti-nuclear matrix protein 2 positivity (80%) was the most frequent MSA. Antinuclear matrix protein 2 antibody is associated with severe muscle involvement, gastrointestinal bleeding, ulcers, and dysphagia, often necessitating aggressive treatment [16, 17]. In this study, patients in this cluster received cyclophosphamide more frequently than those in other clusters. In another JDM cluster study, hypermyopathic patients exhibited symptoms such as choking, hoarseness, dysphagia, muscle weakness, and myalgia. Similar to our study, NXP2 positivity and the need for aggressive immunosuppressive therapy were more common in this group [15]. Therefore, in patients with severe muscle weakness at diagnosis, gastrointestinal bleeding, ulcers, and dysphagia should be considered, and early aggressive treatment is recommended.
In Cluster B (amyopathic/hypomyopathic patients), none of the patients had muscle weakness. Clinically amyopathic dermatomyositis (CADM) is used as an umbrella term for patients with typical skin findings but no myositis (amyopathic) or with subclinical myositis (hypomyopathic, where laboratory findings suggest myositis without clinical myositis symptoms) [18]. Clinically amyopathic dermatomyositis patients have been reported to be at increased risk for ILD, including rapidly progressive ILD, which is an important cause of mortality in JDM [19]. Although ILD is rare, it is more frequently observed in CADM compared to classic dermatomyositis and is especially associated with MDA5 autoantibody positivity [20, 21]. In contrast to previous studies, no ILD was found in the amyopathic/hypomyopathic group in our study, possibly due to the low MDA5 positivity in this group. In agreement with other studies, we found NXP2, TIF1, and Mi-2 autoantibodies, in addition to MDA5, in this group [18]. However, given the cases reported in the literature, careful follow-up is crucial for detecting rapidly progressive ILD in this group, with a focus on autoantibody evaluation.
Cluster C (patients with skin manifestations and lung involvement) showed a higher incidence of ILD, cutaneous ulcers, and calcinosis compared to other clusters. Interstitial lung disease has been reported in 7–19% of JDM patients [22, 23], and in our study, ILD was found in 11.9% of all patients, which aligns with the literature. A meta-analysis of 90 ILD cases in juvenile idiopathic inflammatory myositis (77% JDM) reported that skin manifestations, especially cutaneous ulcers, were the most common feature, occurring in 26% of patients [24]. Other studies have also explored the relationship between cutaneous ulcers and lung disease [25–27]. The increased risk of ILD in the presence of calcinosis and cutaneous ulcers should be considered.
In this study, the overall prevalence of calcinosis was 33.5%, and the overall prevalence of lipodystrophy was 9.1%. Calcinosis is not uncommon in JDM and can lead to complications in cutaneous and subcutaneous tissues, such as skin ulcers, infections, joint contractures, and entrapment neuropathy [28, 29]. Calcinosis may occur alongside panniculitis, another subcutaneous tissue finding in JDM, which often resolves with lipodystrophy or lipoatrophy [30]. In Cluster D (complicated skin manifestations), more than half of the patients had calcinosis, and all had lipodystrophy. Typical skin findings and muscle weakness were common in this cluster, but there was no other organ involvement. Antinuclear matrix protein 2 and TIF1 autoantibodies were detected in this cluster, both of which are associated with severe, treatment-resistant chronic skin lesions. This group represents a unique and newly defined subgroup, characterised by complicated cutaneous manifestations without significant organ involvement, such as lung or oesophageal disease.
Cluster E, which had the highest number of patients, was characterised by muscle weakness, typical cutaneous manifestations, fatigue, and myalgia, but with minimal organ involvement. This group corresponds to “classic JDM”, which is more commonly seen in clinical practice and is generally easier to manage due to the lack of major organ involvement.
It is well-established that autoimmunity and autoantibodies targeting nuclear and cytoplasmic components play a key role in the pathogenesis of JDM. Myositis-specific antibodies and MAAs are detected in approximately 40% of paediatric patients with myositis-associated connective tissue diseases [4]. In our study, MSA positivity was observed in 65.2% of patients, with the most common MSAs being NXP2 (26.1%), TIF1 (20.9%), and MDA5 (11.3%), consistent with the literature [26]. These autoantibodies help guide diagnosis, clinical phenotyping, and prognosis, aiding in the early recognition of non-classical presentations. However, false positive/negative results or multiple autoantibody positivity in a single patient may occur, highlighting the importance of considering the clinical phenotype when interpreting autoantibodies.
Nailfold capillaroscopy provides a non-invasive means of detecting vascular abnormalities in the nailbed. The “scleroderma pattern” is a characteristic finding of systemic sclerosis and is an important tool for the early diagnosis of the disease. Nailfold capillaroscopy findings have been linked to diagnosis, organ damage, autoantibodies, and treatment response in systemic sclerosis [31–39]. In JDM, microvascular findings on NFC vary [40–43]. A limited number of studies have reported that the scleroderma pattern is more common in JDM than in polymyositis, particularly in patients with active skin lesions and higher overall disease activity [44–46]. One study investigating the relationship between NFC and lung involvement in JDM found that patients with lower capillary density had reduced forced vital capacity, and total lung capacity, and more frequent low DLCO values compared to those with normal capillary density [47]. In this study, the scleroderma pattern was found in half of the patients who underwent NFC, with the highest frequency in Cluster C, which was characterised by prominent skin and lung involvement.
The 5 subgroups identified in our study align with clinical practice and incorporate both NFC and autoantibody results. These clusters highlight distinct courses, including amyopathic/hypomyopathic progression, severe muscle involvement, important organ involvement (e.g. lung and oesophagus), and complicated skin manifestations, providing valuable insights through hierarchical cluster analysis.
Study limitations
The limitations of this study include missing data and the potential for bias due to its retrospective design. Because JDM is a rare disease, some clinically important data (e.g. cardiac involvement) could not be included in the analysis. Additionally, not all patients had autoantibody or capillaroscopy results. Nevertheless, this study lays the groundwork for future research, especially as MSA testing and NFC become more widely available. Furthermore, the differences observed in cluster sizes in our study reflect the heterogeneous nature of JDM. Clusters that represent patient profiles more commonly encountered in clinical practice (e.g. Cluster E) tended to be larger, whereas subgroups with distinct clinical features such as rare organ involvement (e.g. Cluster A) were grouped into smaller clusters. While the small sizes of these clusters may present limitations in terms of generalisability, they are valuable in highlighting the diversity of JDM subtypes and the potential existence of unique clinical patterns. Therefore, further detailed evaluation of patient groups within smaller clusters, and validation in different cohorts, would contribute to a better understanding of the clinical subtypes of JDM. In this context, future studies involving larger patient populations are of great importance.